Datawrapper
- Last Updated: 11/29/2018 12:00:00 AM
- Site: https://www.datawrapper.de/
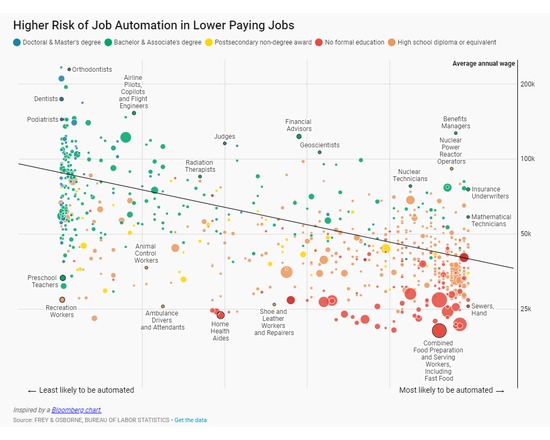
Datawrapper is a tool built to make it easy for journalists and other content-creators to create simple charts and maps for web articles. To make a chart, you paste in your numbers and choose a chart type. We make sure that the chart you’ll embed in your article at the end is beautiful, responsive and interactive.
Our charts feel at home on the web. They’re interactive, responsive and embeddable in your website.
No code or design skills required. The way from data to a beautiful chart is shorter than you think.
1. Copy & Paste your data: Simply copy your data from Excel or Google Sheets. You can also upload CSV files or link to an URL for live-updating charts.
2. Visualize: Choose from many chart and map types with one click. Customize and annotate your chart to make it more effective.
3. Publish your chart: Copy the ready-to-use embed code into your CMS or website, or export the chart as an image or PDF to print it.
Attributes
- Type of analysis: Visualization Publishing
- Type of license: Commercial Closed Source
- Background Processing: Doesn't Run in Background
- Web Usable: Run in Browser
- TaDiRAH Methods: Publishing Sharing Visualization
List this tool appear on
Rating
Suggested Tools
Comments