Infogram
- Last Updated: 11/30/2018 12:00:00 AM
- Site: https://infogram.com/
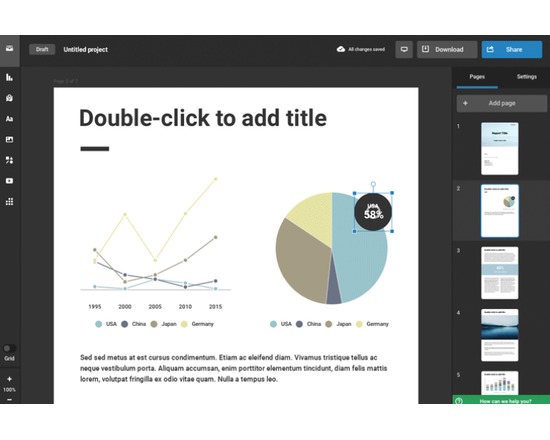
The simple way to make all your data dazzle
Infographics: Create stunning infographics that boost visitor engagement on your website or blog.
Reports: Stand out with interactive marketing reports, sales collateral, and more.
Charts: High-quality graphs and charts are a snap. Just import your data, customize, and share.
Dashboards: Connect your data to build live, easily shareable dashboards that visually track your business.
Maps: Use our map maker to publish professional-quality interactive maps that impress and inform.
Social Media Visuals: Use our huge bank of photos and icons to create stunning images for Facebook, Instagram, and Twitter.
Documentation
Attributes
- Type of analysis: Visualization
- Type of license: Commercial Closed Source
- Background Processing: Not Applicable
- Web Usable: Run in Browser
- TaDiRAH Methods: Visualization
List this tool appear on
Rating
Suggested Tools
Comments