Dygraphs
- Last Updated: 11/30/2018 12:00:00 AM
- Site: http://dygraphs.com/
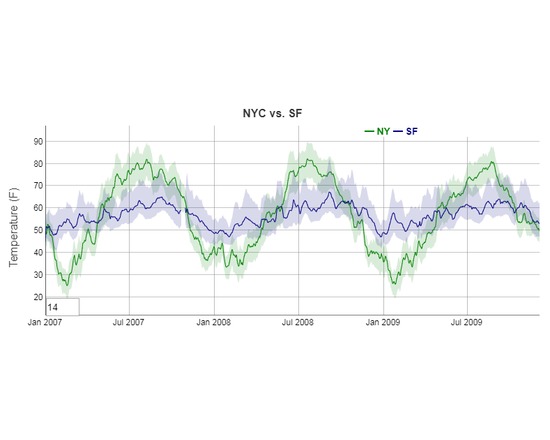
dygraphs is a fast, flexible open source JavaScript charting library.
Features:
-Handles huge data sets: dygraphs plots millions of points without getting bogged down. Interactive out of the box: zoom, pan and mouseover are on by default.
- Strong support for error bars / confidence intervals.
- Highly customizable: using options and custom callbacks, you can make dygraphs do almost anything.
- dygraphs is works in all recent browsers. You can even pinch to zoom on mobile/tablet devices!
- There's an active community developing and supporting dygraphs.
Documentation
Attributes
- Type of analysis: Visualization Analysis
- Type of license: Free Open Source
- Web Usable: Software you Download and Install
- TaDiRAH Goals: Analysis
- TaDiRAH Methods: Visualization
List this tool appear on
Rating
Suggested Tools
Comments