chart.io
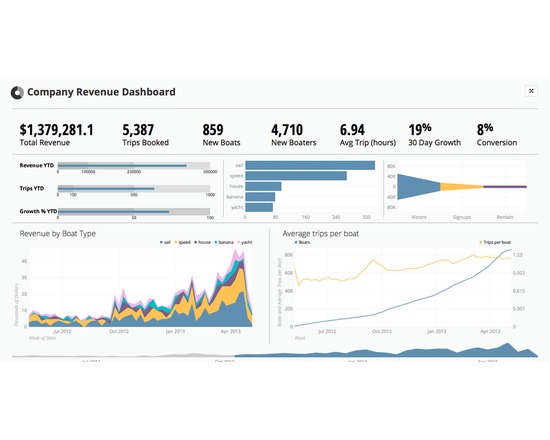
Create interactive charts and perfect dashboards through an intuitive drag and drop interface. Switch from basic tables to sophisticated data visualizations in a single click. Powerful filters let you slice and dice your data, and you can drill down into most charts without configuring a thing.
Chartio currently provides nine essential visualization types that can be tweaked, designed, and iterated in any number of ways.
Chartio lets you blend data sources in-browser, without the need to clean or format your data in advance. At the very moment you start to explore your data sources, you can blend them together with just a few clicks and chart the results.
Attributes
- Web Usable: Run in Browser
List this tool appear on
Rating
Suggested Tools
Comments