Curated list
IBPAD Toolkit
Pedro Meirelles
A list of tools for data analysis, collection and visualization.
19 tools
-

-

-
03
WORDij
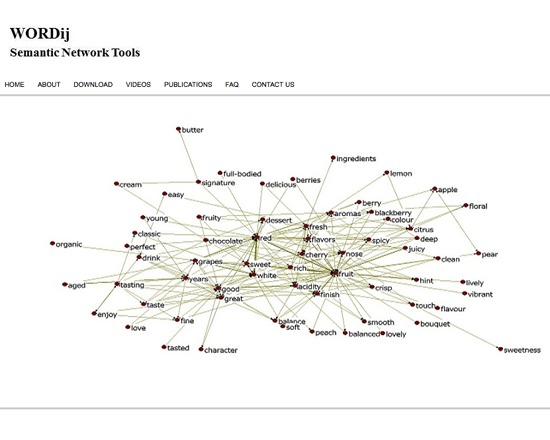
WORDij is a free semantic network tool for capturing relationships between words and assigning word-pair link strengths. This information is used as the basis for more sophisticated analysis, such as word network structure mapping. WORDij requires registration for download.
-
04
NodeXL
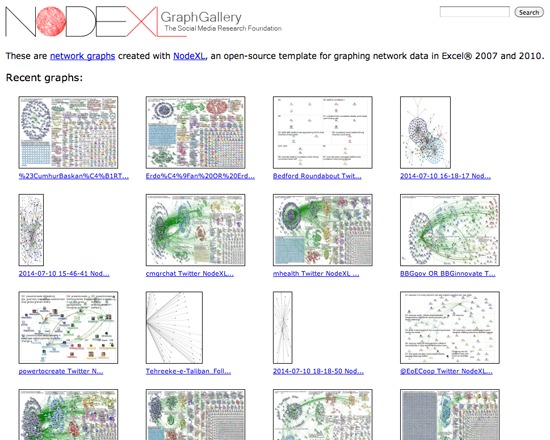
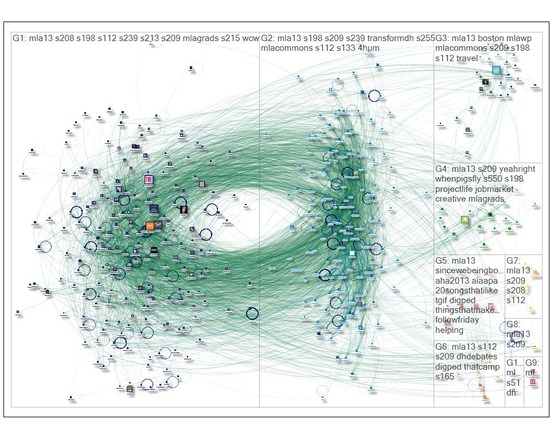
NodeXL is a free, open source tool for generating and exploring network graphs from Microsoft Excel files. It is particularly suited to data from social media sources, and includes the ability to directly import data from Twitter, YouTube, Flickr and email, with additional plugins available for gathering data from Facebook, Microsoft Exchange, wikis and URLs. The tool generates visualizations that can be adjusted, zoomed and filtered, with additional features for vertex grouping, graphing metric calculations, and automating tasks. NodeXL can both import and export data in GraphML, Pajek, UCINet and matrix formats.
-
05
Netlytic
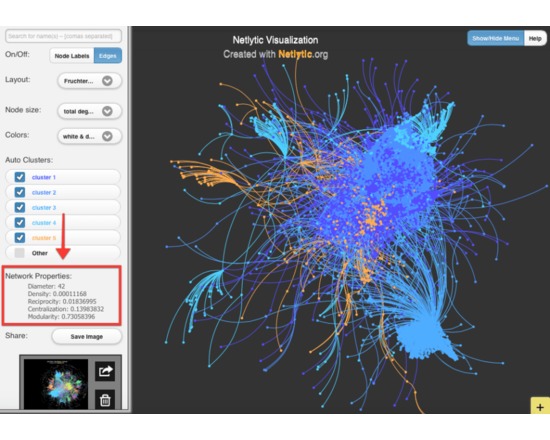
Netlytic is a community-supported text and social networks analyzer that can automatically summarize and visualize public online conversations on social media sites. It is made for researchers by researchers, no programming/API skills required. With Netlytic you can: capture publicly available posts from social media sites or other sources (Twitter, YouTube, RSS Feed, or text/csv file) Discover popular topics Find and explore emerging themes of discussions Build, visualize and analyze online communication networks using social network analysis Map geo-coded social media data
-
06
KH Coder
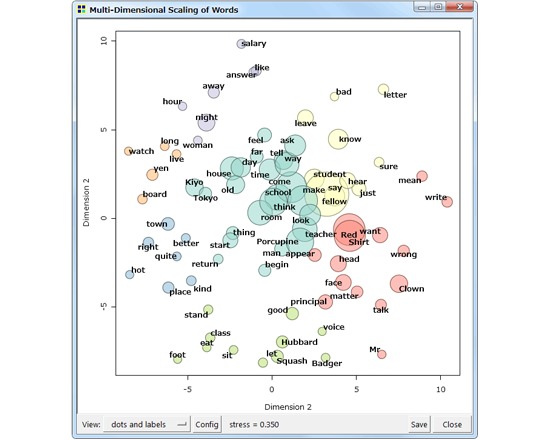
KH Coder is a tool for quantitative content analysis and text mining that has been under continuous development since 2001. It was originally developed for Japanese text and now supports numerous other languages, including English, Italian and French. KH Coder also has computational linguistics applications.
-
07
KH Coder
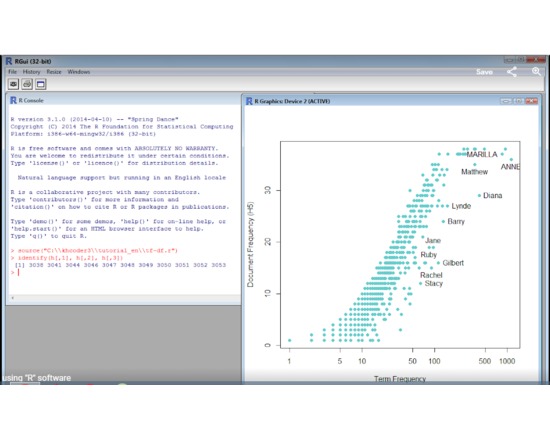
KH Coder is a free software for quantitative content analysis or text mining. It is also utilized for computational linguistics. You can analyze Catalan, Chinese (simplified), Dutch, English, French, German, Italian, Japanese, Korean, Portuguese, Russian, Slovenian and Spanish text with KH Coder.
-
08
AntConc
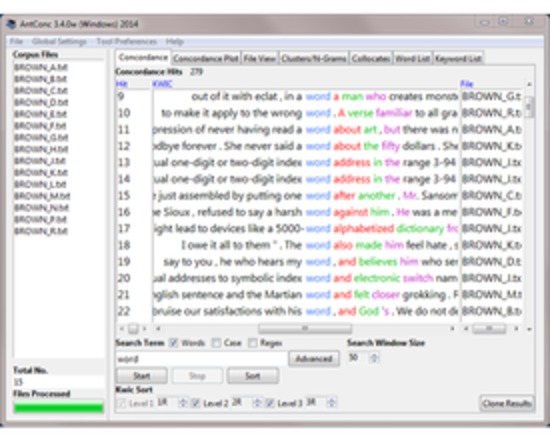
AntConc is free concordance software. It is multi-platform and easy to deploy and use. AntConc is part of a suite of related tools for text processing and analysis, including applications for parallel corpus analysis, word profiling, PDF to text conversion, text structure analysis, detecting and converting character encodings, Japanese and Chinese segmenter and tokenizer, wordclass tagger, and spelling variant anaysis. The developer is currently drafting a more explicit licence for the use of the software.
-
09
Textometrica
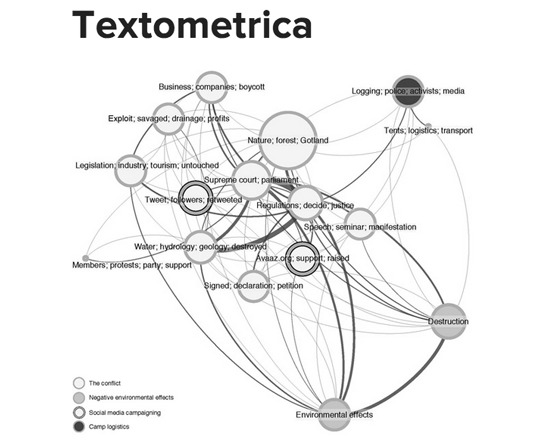
Textometrica is a free, web based text analysis tool offered by HUMlab at Umeå University. Users can upload a plain-text file and examine its word frequencies, see co-occurrences, and generate visualizations and graphs.
-
10
Gephi
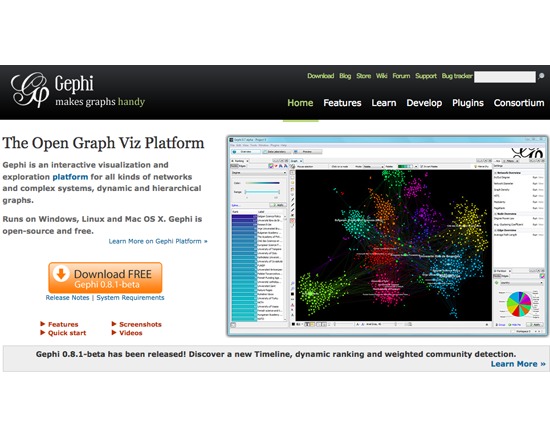
Gephi is a free, open source interactive visualization and data exploration tool. Users can manipulate the display to uncover new facets of the data, enabling intutive exploration.
-
11
RQDA
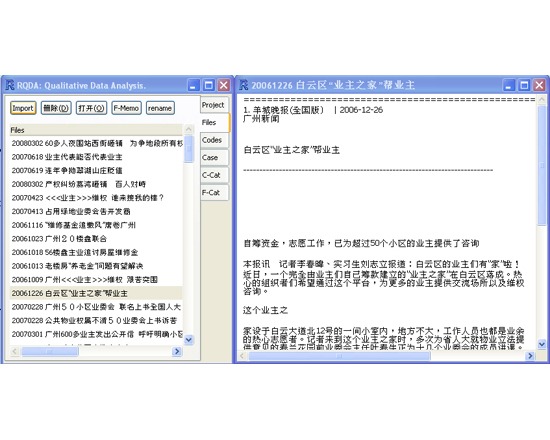
RQDA is a free R package for qualitative analysis, developed specifically to analyze textual data. It is available for Windows, Linux/FreeBSD and Mac OS X. It currently requires texts to be in plain text format. RQDA supports non-English texts, and has been tested with Simplified Chinese in particular.
-
12
WordWanderer
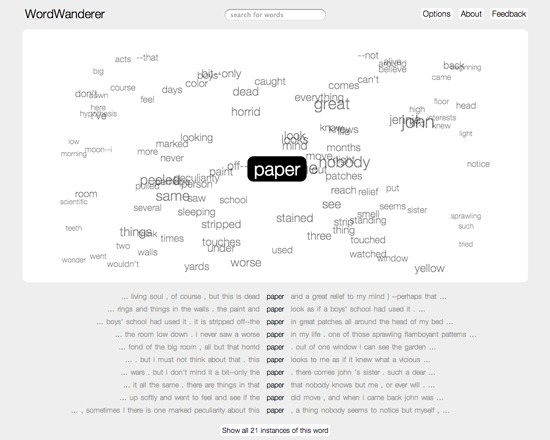
WordWanderer is a free, web-based tool for visualizing and exploring text. It combines search, concordance and word cloud attributes to enable users to explore their texts. Users can paste their own texts into the box provided, or choose from a list of preloaded texts. It includes the ability to include or hide words based on parts of speech, a stop list or a user-provided list, and can display the text based on relative frequency, context or comparison. To view specific words, users can search them or click on them in the visualization.
-
13
NodeXL Network Graphs
From the website: NodeXL is a free, open-source template for Microsoft® Excel® 2007 and 2010 that makes it easy to explore network graphs. With NodeXL, you can enter a network edge list in a worksheet, click a button and see your graph, all in the familiar environment of the Excel window. (http://nodexl.codeplex.com/) The book Analyzing Social Media Networks with NodeXL: Insights from a Connected World is the most comprehensive source on NodeXL. Accompanying slides and datasets are available on the NodeXL Teaching Resources page. (http://nodexl.codeplex.com/documentation)
-
14
RAW
RAW is a free, open-source web application for creating visualizations that can be exported in SVG or PNG format and embedded into a website. Users can upload data with RAW's web interface and generate a variety of vector-based visualizations. RAW uses the D3.js library, and is maintained by the Density Design research studio at Polaitecnico di Milano.
-
15
Flourish
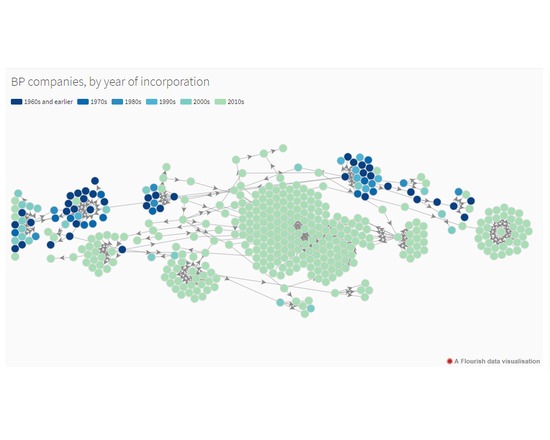
Explore and explain your data with stunning visualizations and stories. Publish, present or download. No need to code or install software.
-
16
Netlytic
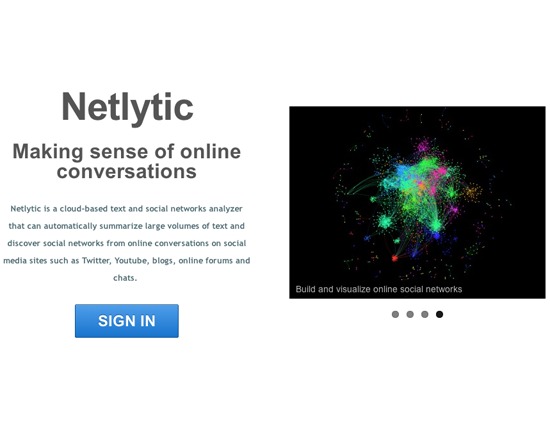
Netlytic is a free, web-based tool for analyzing and visualizing text and social network data. It enables users to capture data from sources such as social media, blogs or online forums; identify themes and actors; and generate both chain and personal name networks for further analysis and visualization. Users can import datasets from RSS, cloud storage (Google Drive or Dropbox), Twitter, YouTube, Instagram and a plain text file. Results can be exported in formats accessible to other network analysis tools, such as CSV.
-
17
Issuecrawler
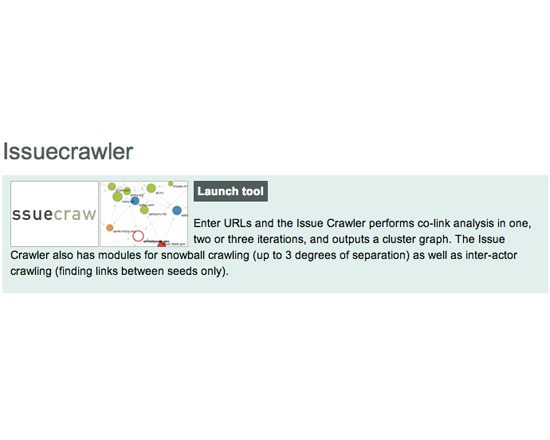
Issuecrawler is a free, web-based tool for performing co-link analysis on URLs, and generating a cluster graph of the results. Its options include snowball crawling for up to three degrees of separation, and inter-actor crawling. Users must request a free account before using the tool.
-
18
TAGS (Twitter Archiving Google Spreadsheet) v5.1
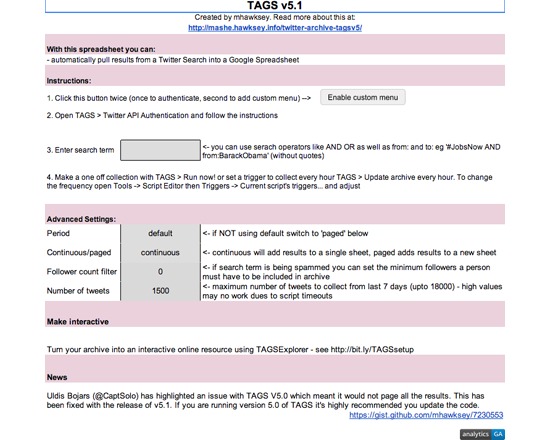
TAGS (Twitter Archiving Google Spreadsheet) v5.1 is a tool for automatically pulling Twitter search results into a Google spreadsheet for further analysis. Users can set TAGS 5.1 to update the resulting archive hourly or at a frequency of their specification, and includes options for filtering out spam, result pagination, and setting an upper limit on tweets collected (to a maximum of 18000).
-
19
Netvizz
Netvizz is a free, web-based tool for extracting datasets from Facebook. As the tool utilizes Facebook Apps, users must have a Facebook account to access it.