Skip to content
TAPoR Text Analysis Portal for Research

Tools

Sort by Name Rating ↓ Date

Polymaps

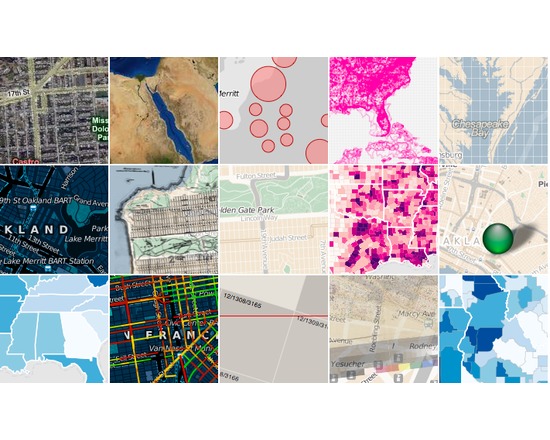
Polymaps is a free JavaScript library for making dynamic, interactive maps in modern web browsers. Polymaps provides speedy display of multi-zoom datasets over maps, and supports a variety of visual presentations for tiled vector data, in addition to the usual cartography from OpenStreetMap, CloudMade, Bing, and other providers of image-based web maps. Birmingham Airport Parking Manchester Meet and Greet

Rated 0.0 out of 5.

JsFiddle

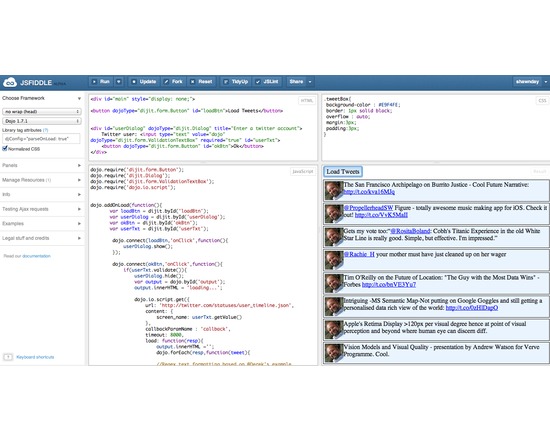
JsFiddle is a prototyping tool for web developers, a tool which may be used in many ways. It can be used as an online editor for snippets build from HTML, CSS and JavaScript. The code can then be shared with others, embedded on a blog, etc. Using this approach, JavaScript developers can very easily isolate bugs. We aim to support all actively developed frameworks - it helps with testing compatibility.

Rated 0.0 out of 5.

Visualization

TimeGlider

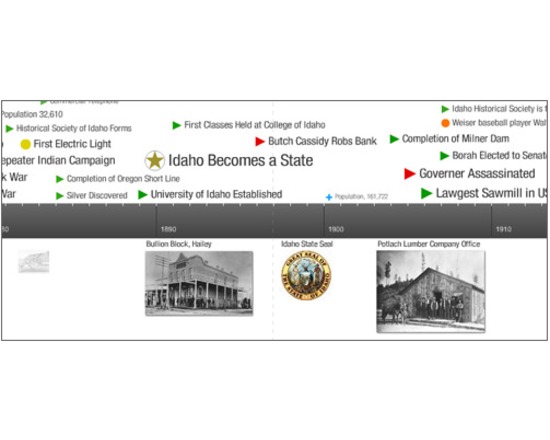
TimeGlider is a data-driven interactive timeline application built using JavaScript. You can "grab" the timeline and drag it left and right, and zoom in and out to view centuries at a time or just hours. TimeGlider allows you to create event-spans so that you can see durations and how they overlap. Being web-based, TimeGlider lets you collaborate and share easily.

Rated 0.0 out of 5.

Nominatim

Nominatim is a tool to search osm data by name and address and to generate synthetic addresses of osm points (reverse geocoding). Nominatim is also used as one of the sources for the Search box on the OpenStreetMap home page and powers the search on the MapQuest Open Initiative websites.

Rated 0.0 out of 5.

Visualization

yED Files

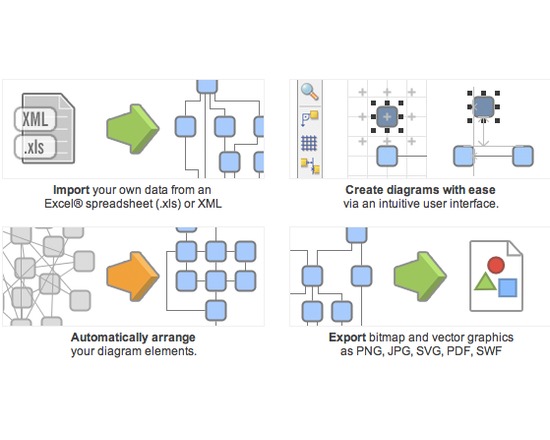
yWorks is a powerful set of tools for creating diagrams using any number of frameworks. There are tools for working with HTML, FLEX, AJAX, Silverlight, Java and .NET. yEd is also available from the yWorks site. This free graph editor can be used to create diagrams manually, or to import data for analysis.

Rated 0.0 out of 5.

Visualization

Timeflow

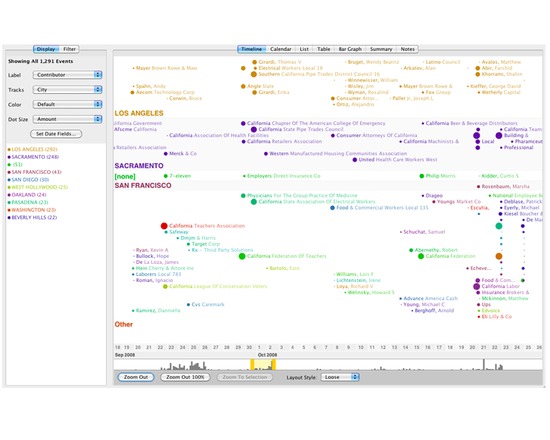
Time Flow is an open-source timeline built to help journalists analyze temporal data. The application offers several view modes--timeline, calendar, list, table--to help explore thousands of data points. It is not a web-based tool--it is a desktop application that can run off a thumb-drive and is built to handle large datasets, and timeline events that may include approximate dates or date spans. The project is in the alpha stage of development, but is available for download from Github.

Rated 0.0 out of 5.

Analysis

GRETL

GRETL () s a cross-platform software package for econometric analysis, written in C. It features: Easy intuitive interface (now in French, Italian, Spanish, Polish, German, Basque, Portuguese, Russian, Turkish, Czech, Traditional Chinese, Albanian and Greek as well as English) A wide variety of estimators: least squares, maximum likelihood, GMM; single-equation and system methods Time series methods: ARMA, GARCH, VARs and VECMs, unit-root and cointegration tests, etc. Limited dependent variables: logit, probit, tobit, interval regression, models for count and duration data, etc. Output models as LaTeX files, in tabular or equation format Integrated scripting language: enter commands either via the gui or via script Command loop structure for Monte Carlo simulations and iterative estimation procedures GUI controller for fine-tuning Gnuplot graphs Links to GNU R, GNU Octave and Ox for further data analysis

Rated 0.0 out of 5.

Visualization

Protovis

Protovis composes custom views of data with simple marks such as bars and dots. Unlike low-level graphics libraries that quickly become tedious for visualization, Protovis defines marks through dynamic properties that encode data, allowing inheritance, scales and layouts to simplify construction. Protovis is free and open-source, provided under the BSD License. It uses JavaScript and SVG for web-native visualizations; no plugin required (though you will need a modern web browser)! Although programming experience is helpful, Protovis is mostly declarative and designed to be learned by example. Protovis is no longer being developed. The developers have moved on to a new visualization library, D3.

Rated 0.0 out of 5.

Visualization

D3.js

D3.js is a data visualization library by Mike Bostock, who is also the primary creator of Protovis, which D3 is designed to replace. There is a great introductory tutorial available from Luke Franci. It is one of many other tutorials linked to from Bostock's D3 wiki.

Rated 0.0 out of 5.

WordVenture

WordVenture is an interactive visualization of the WordNet database that employs the technology and interface of TouchGraph.

Rated 0.0 out of 5.