Plotting Characteristic Curve of Word Lengths
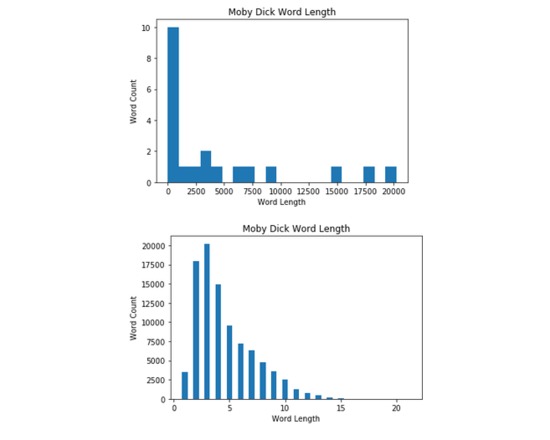
Code that reads a .txt files and plot the characteristic curve of words lengths of the text. Finally it graphs it using matplotlib
Code that reads a .txt files and plot the characteristic curve of words lengths of the text. Finally it graphs it using matplotlib
Gathering
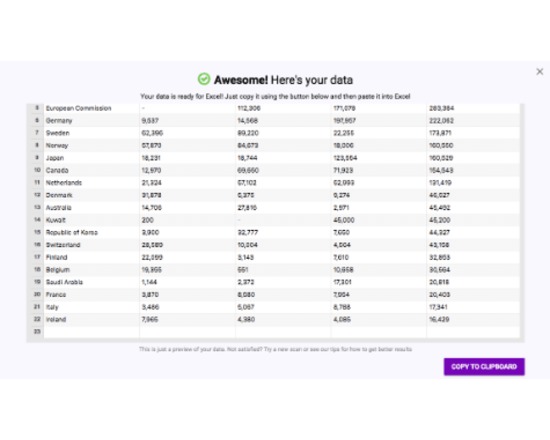
Tabello is a research tool that makes it easy to extract table data from PDFs to Excel. It is optimized for PDFs where tables are found on only a few pages (e.g. annual reports, research reports, academic papers) of a document. With Tabello you simply drag a selection box around the table you want to convert and it instantly becomes ready to paste into Excel. As Tabello comes as a Chrome extension you don't need to download/upload files but continue to work in your browser, making it always available.
Collaboration
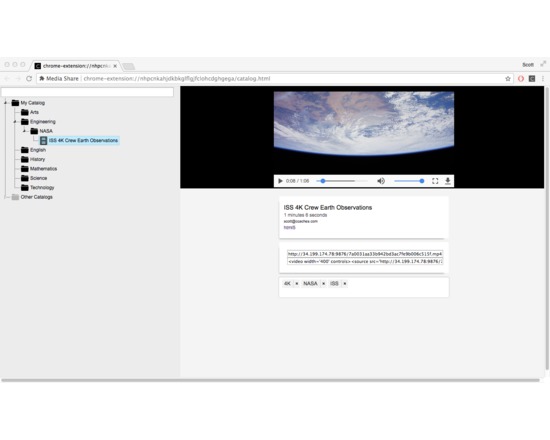
There is an unlimited number of videos, PDFs, etc. that can be used for education, training, instruction, or professional development. Finding and curating them into playlists, integrating with existing workflow, and sharing with others is time consuming, inefficient, and often limited by ‘vendor lock-in.’ Media Share is a productivity tool that saves time, requires no training to use, and does not limit how or where content can be used.

Uncategorized
A collection of word lists for different topics from Enchanted Learning. The word lists can be used to measure frequency of topic related words.
Search
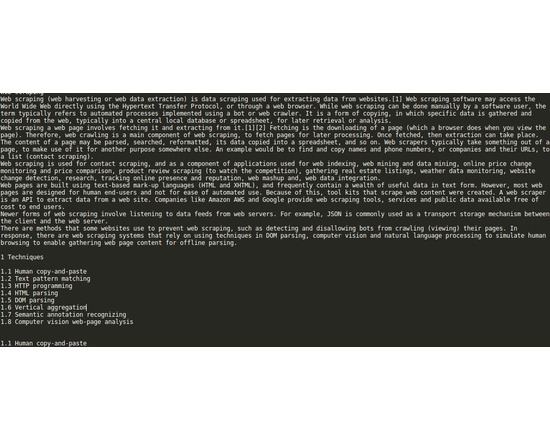
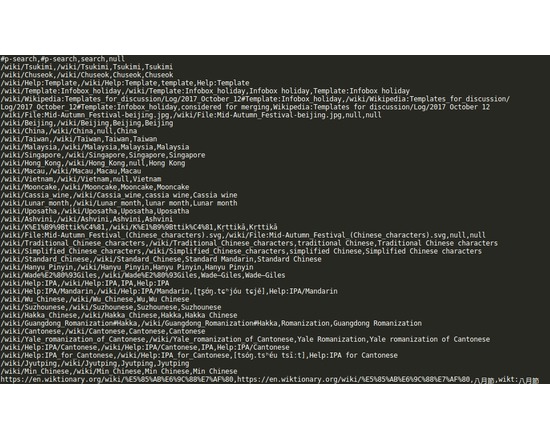
This notebook examines how to scrap a webpage. Here we will be using Wikipedia and New York Times as an example.
Capture
This code uses Beautiful Soup 4 to gather all the URLs present on a web page (including the redirect and meta data) and saves them in a csv

This tool calculates Term Frequency - Inverse Document Frequency (TF-IDF) for a collection of documents showing the salient words. It also does relative frequency.

Search
Mozenda offers a web scraping tool/service that you can use to build agents that scrape and then organize how you want the data. You use a client side Windows. They have a free 30 day trial. Otherwise a commercial service.

Search
80legs is a web crawling service. You need to get an account and then you can create custom crawls that run in the cloud. They also let you filter their Giant Web Crawl and provide clean data about the web.
Visualization
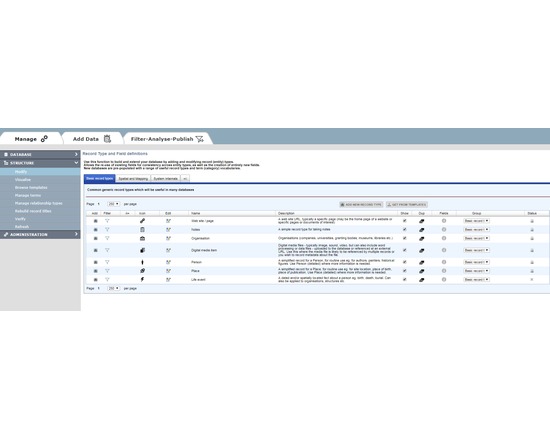
HEURIST (http://HeuristNetwork.org) is an extremely flexible, end-user oriented, web-based data management system designed specifically for Humanities data. Developed since 2005, it has been in active use across many projects since 2009. It is available both as a free web service for researchers (hosted at the University of Sydney Data Centre) or for installation on a physical or virtual server (Open Source on gitHub). Researchers can design, create, manage, analyse, visualise and publish their own richly-structured database(s) through a simple web interface, without the need for programmer(s). Quite complex databases can be built in a few hours by borrowing structures and vocabularies published by other users. Databases can be designed and built incrementally, as existing data are not affected by changes in structure. Databases created by Heurist are stored in MySQL with a repeatable structure facilitating sustainability and independent access by other software. Advanced features include record linking, graph structure, drill-down facet searches, rule-based queries, custom reports, linked map-timelines, network visualisation, normalised spreadsheet import, crosstabulation, XML feeds, XSLT transforms. The team provides initial email and skype assistance for project setup at no cost, and special customisations at modest cost. Heurist is applicable in many domains including History, Archaeology, Anthropology, Cultural Research, Linguistics, Media Studies etc. It handles everything from text, tags and categories, through networks of rich relationships and offset annotations, to images, video, spatial data and dating (including non-western systems and dating uncertainty). Sophisticated searches (including faceted and rule-based) can be saved, organised and rendered as layered interactive maps, timelines, network visualisations, crosstabulations, lists, custom reports, XML and XSLT transforms, all of which can easily be printed or embedded (live) in a website - Heurist provides the html code required to embed results in a web page or CMS. Databases can easily be migrated later to a personal or institutional server. Since the data are stored in a standard MySQL database with a fixed and well-documented structure, the data can be accessed directly via SQL from most programming languages independently of Heurist. Version 4.2 (Jan 2016 onwards) is available as a service via the Heurist website. Version 4 delivers a user-customisable interface of widgets, along with better mapping and visualisation. Existing version 3 databases are bidirectionally compatible with version 4.