UMapper allows users to create embeddable, interactive Flash maps and geo-games from within their browser. There is a free option available with limited customization, and a more flexible paid option; see the feature comparison.
Mapstraction is a Javascript library. It provides developers with a single interface for a wide variety of Javascript map APIs including Leaflet, Google, Bing, OpenLayers and ESRI's ArcGIS. A key benefit is that once a developer has loaded Mapstraction, s/he can to switch from one map API to another quickly and easily - often only needing to change a few lines of code. Mapstraction displays points, lines, polygons and markers on the maps, and also allows developers to add base maps and overlays.
OpenLayers is a Javascript library that can display map tiles and markers loaded from any source in web browser. It provides an API for building rich web-based geographic applications. OpenLayers makes it easy to put a dynamic map in any web page. It can display map tiles, vector data and markers loaded from any source. OpenLayers has been developed to further the use of geographic information of all kinds. It is completely free, Open Source JavaScript, released under the 2-clause BSD License (also known as the FreeBSD).
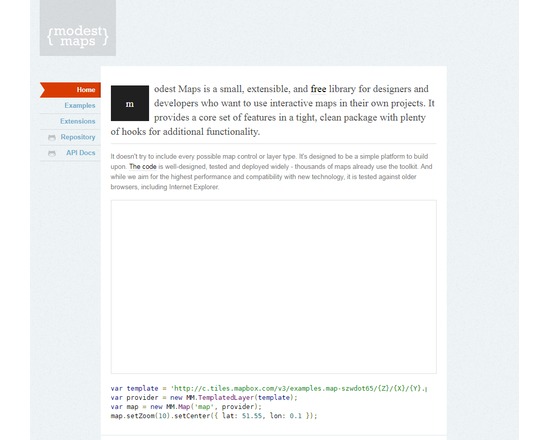
Modest Maps is a small Javascript library for interactive tile-based maps that can display maps from external sources (e.g. OpenStreetMap, but not commercial layers like Google Maps), enable panning and zooming, and track the position of points based on XML data. It is designed to be lightweight and offer a minimal set of features, and therefore has less functionality than Leaflet, a similar tool.
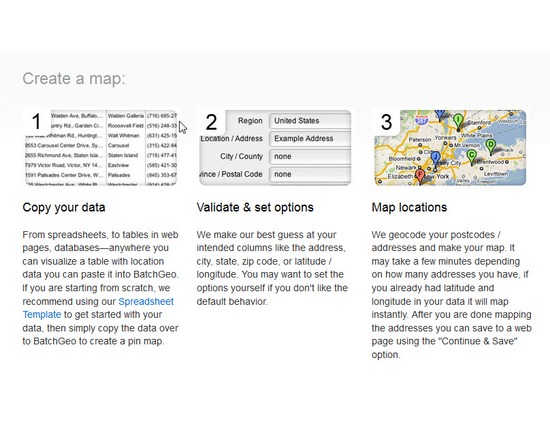
BatchGeo is an online service that maps address data as points. The cut and paste interface makes it easy to convert a spreadsheet of street addressed into a map can be embedded or downloaded as a KML file. A limited number of addresses can be mapped for free; large files require a subscription.
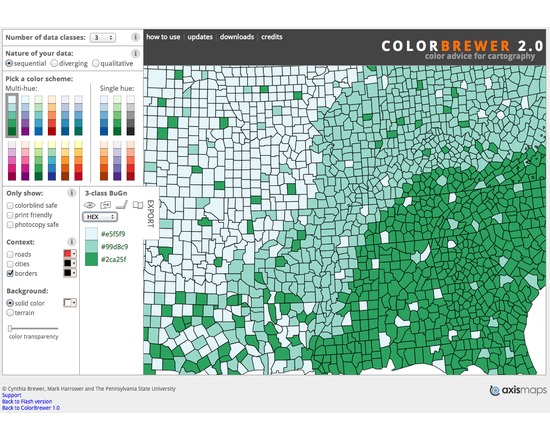
ColorBrewer is a web tool for selecting color schemes for thematic maps, most usually for choropleth maps. It includes 35 basic schemes with different numbers of classes for over 250 possible versions. Each scheme has CMYK, RGB, Hex, Lab, and AV3 (HSV) specs for the colors. The software is designed simply to list color specs for a scheme you find useful so you are able to create these colors in the mapping software you are using. It should be noted that ColorBrewer is not mapping software. It is designed specifically for users to look up color sets to use in mapping environments. It does not allow you to read in your own data and it will not open any other geography files.
ZeeMaps quickly maps point data on Google base maps in two ways: 1) The user uploads a .csv file of data points and their locations. 2) A group of users all add their own data location points to the map, on their own time from their own devices. Each point can include text, video, image, or audio annotations. Basic functionality is free; larger uploads and large numbers of maps require a paid subscription.
ArcGIS is a suite of software that comprises of Desktop GIS, Server GIS, Mobile GIS, and ArcGIS Online. ArcGIS is a platform for building a complete geographic information system (GIS) that lets you easily create, edit, and analyse geographic knowledge on the desktop; publish data, maps, globes and models to a GIS server and/or share them online; and use them on the desktop, on the Web, or in the field. Features: View and query maps Manipulate shapefiles and geodatabases Data manipulation, editing and analysis Mobile device enabled
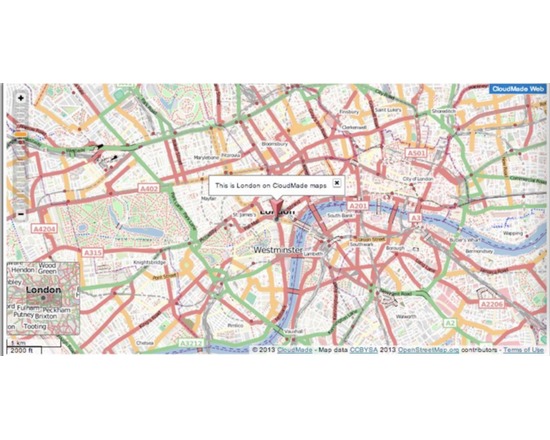
Crowdmap allows the investigator to set up a Web map around a particular topic and invite multiple users (participants, research subjects, collaborators, multiple assistants) to contribute information to the map on their own time and from their own device. For $10/month, users can buy fee-based services including private maps and custom branding. Users have complained that Crowdmap is glitchy and unreliable. It is hard to find recent examples of successful projects built with the app. There is no other free and open source tool that fills the precise niche. For a freemium closed source service that allows crowdsourced point data only, try ZeeMaps. For a fee-based, open source crowd mapping tool, try the shared tables function of CartoDB.
Ushahidi is a software for information collection, visualization and interactive mapping, to build tools for democratizing information, increasing transparency and lowering the barriers for individuals to share their stories. It has been used for election monitoring, crisis and emergency response, civil society, city/community building, arts and even where to find the best burger. Specific tools: Crowdmap: A simple map-making tool, built on an open API, that allows for collaborative mapping Swiftriver: Curate real-time data and analysis from a variety of sources, including social media streams CrisisNET: A consolidated source of global crisis data Ping: Two-way multichannel group alert during an emergency SMSSync: Create a two way gateway with an Android phone and local SIM anywhere in the world BRCK: Supports connectivity in remote locations, self-powered, mobile WiFi device