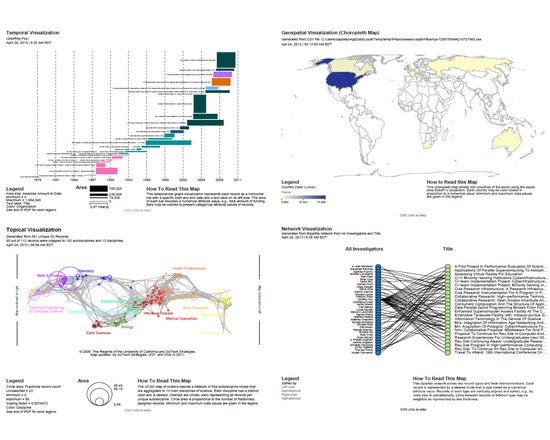
The Science of Science (Sci2) Tool is a modular toolset supporting temporal, geospatial, topical, and network analysis and visualization of datasets at the micro (individual), meso (local), and macro (global) levels. Users of the tool can: Access science datasets online or load their own Perform different types of analysis with the most effective algorithms available Use different visualizations to interactively explore and understand specific datasets Share datasets and algorithms across scientific boundaries
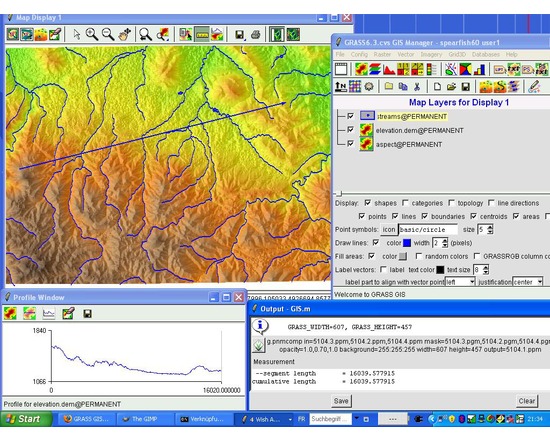
GRASS GIS is free and open source software used for geospatial data management and analysis, image processing, graphics/maps production, spatial modeling, and visualization. GRASS is currently used in academic and commercial settings around the world, as well as by many governmental agencies and environmental consulting companies. Comparison to QGIS: Like GRASS, QGIS is free, open source, developed by volunteers, and has a robust and active online user community. However, GRASS is mainly used for highly technical purposes and mathematical analyses. For more details, see this Stack Exchange thread. QGIS and GRASS do cooperate with each other; Plug-ins and extensions allow GRASS functions to be used inside QGIS.
QGIS is a user-friendly Open Source Geographic Information System (GIS) licensed under the GNU General Public License. QGIS is an official project of the Open Source Geospatial Foundation (OSGeo). It runs on Linux, Unix, Mac OSX, Windows and Android and supports numerous vector, raster, and database formats and functionalities.
Open source map design studio for creating and styling web tile maps, based on either provided free MapBox Geodata, or data imported as a variety of file formats. It uses the CartoCSS styling language to customize interactive visualizations, with powerful control of symbols, zoom levels, labels, and other cartographic details. The finished maps can be exported either as images or tiled web maps. Though the TileMill software is free, there may be a fee to host the created tiles on MapBox or elsewhere.
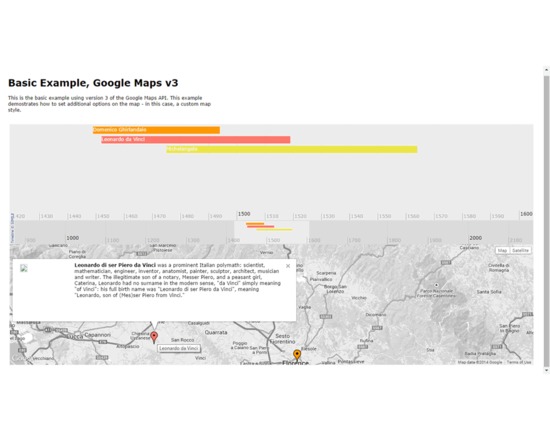
Timemap.js is a Javascript library that helps you to produce online maps (such as Google, OpenLayers, and Bing) along with a SIMILE timeline. You can load one or more datasets (in JSON, KML, or GeoRSS) onto both a map and a timeline simultaneously. By default, only items in the visible range of the timeline are displayed on the map.
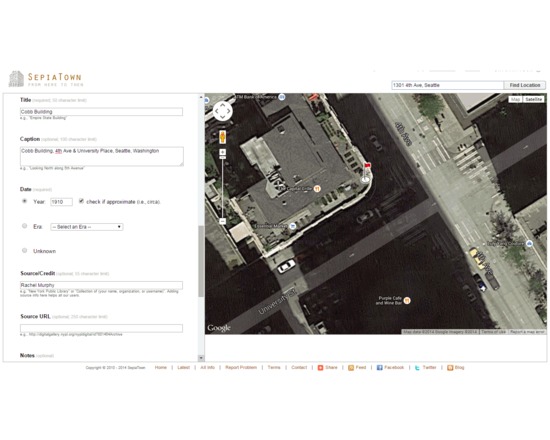
SepiaTown is a cultural history project that aims to provide a window to the past by merging photography, geography, and technology, by acting as a forum for institutions and individuals to share and map historical images. Once they have signed up, users may upload historic images to the site individually or in batches. Each image is given a title, description and keywords, as well as a spatial location represented by a marker on a map. Visitors to the site can search or browse by using keywords and place-names, or by going directly to the map and clicking on a thumbnail to view images directly.
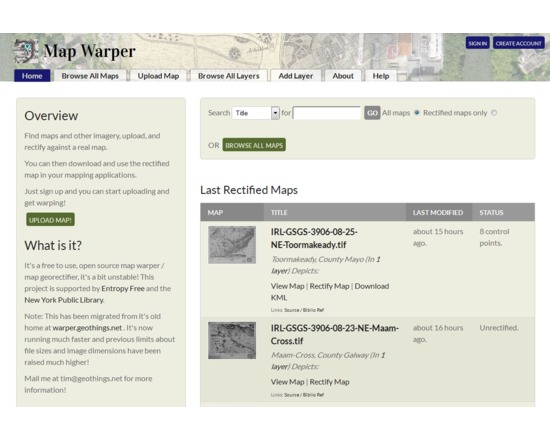
This is an open source platform for georectifying scanned images of maps, so that they can be displayed in web maps or used in GIS applications. It could be particularly useful for creating map overlays for Google Earth or similar applications, without using specialized desktop software. Map images must first be uploaded and made publicly available, and then by aligning with Open Street Map reference data, the maps are warped into georeferenced images. Georectified images are downloadable as GeoTIFF, PNG, or KML files, along with map tiles or WMS capabilities. The same platform was used for NYPL Map Warper and WorldMap Warp.
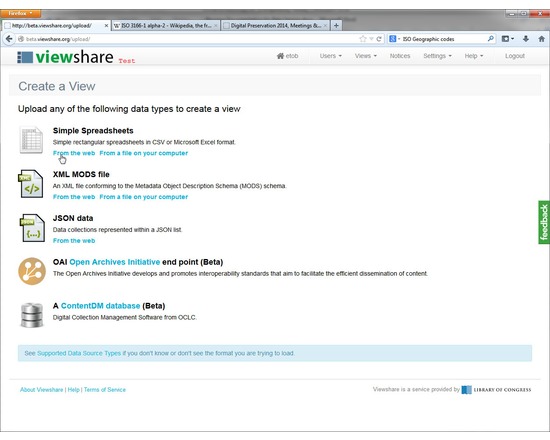
Viewshare is a free web application for creating interfaces and visualizations of cultural heritage collections. It can create interactive maps, timelines, facets, tag clouds, histograms, and image galleries. The intended users of Viewshare are individuals managing and creating access to digital collections of cultural heritage materials. Viewshare is offered as a software as a service (SaaS), email ndiippaccess@loc.gov to request a free account. Import Collection Data: Ingest collections from spreadsheets, JSON, CONTENTdm, XML MODS or OAI records. Upload from your desktop or import them from a URL. Generate Views: Generate distinct interactive visual interfaces to your digital collections, including maps and timelines, and sophisticated faceted navigation Embed & Share:Copy/Paste to embed your visualization interface in any webpage. Provide your users with novel and intuitive ways to explore your content System Requirements: Viewshare makes every attempt to support the following Web browsers: Microsoft Internet Explorer v.7 & 8, Firefox v.3.x and Safari v.3.x. Opera v.9.x, Camino v.1.6.x, Firefox v.4.x, and Chrome v.14.x mostly work but are not as thoroughly tested and not officially supported. Internet Explorer v.6 does not work with some of the software used by Viewshare. Viewshare currently supports the US English (en-US) locale.
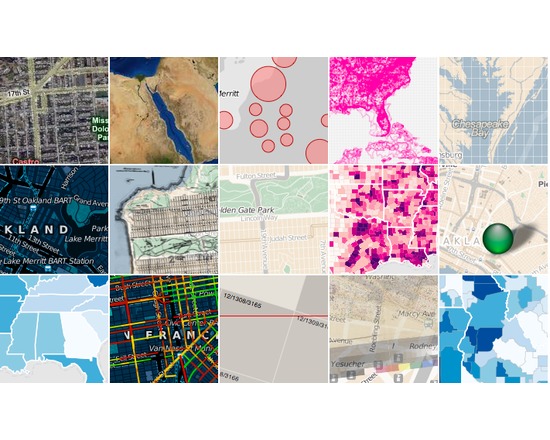
Polymaps is a free JavaScript library for making dynamic, interactive maps in modern web browsers. Polymaps provides speedy display of multi-zoom datasets over maps, and supports a variety of visual presentations for tiled vector data, in addition to the usual cartography from OpenStreetMap, CloudMade, Bing, and other providers of image-based web maps. Birmingham Airport Parking Manchester Meet and Greet