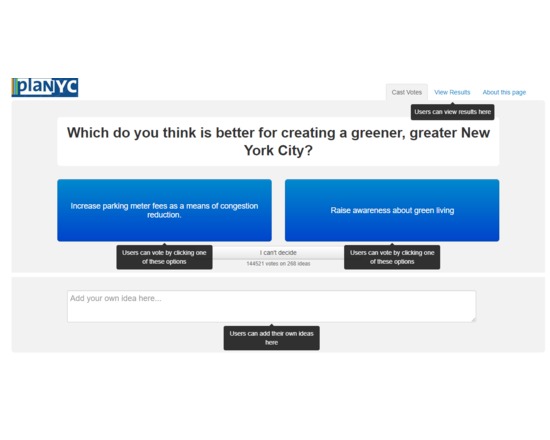
All Our Ideas is a research project that seeks to develop a new form of social data collection by combining the best features of quantitative and qualitative methods. Using the power of the web, we are creating a data collection tool that has the scale, speed, and quantification of a survey while still allowing for new information to "bubble up" from respondents as happens in interviews, participant observation, and focus groups.
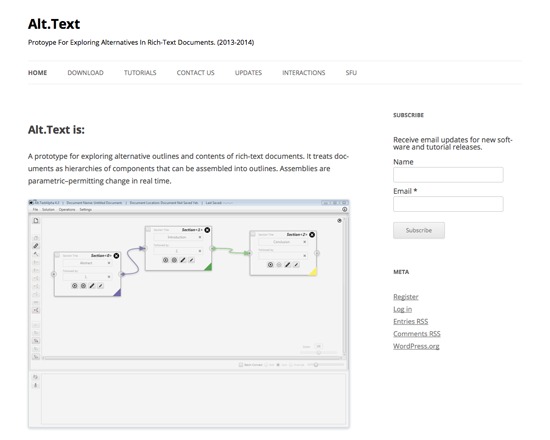
Alt.Text is a free, working prototype application for exploring a text on both an outline and content level via a graphical user interface. It breaks down texts into components such as sections, passages or documents, and permits users to leverage these components to create outlines and break off sections. Alt.Text includes three interfaces: the Document Editor (define sections, create outlines), the Section Editor (define passages of text within a given section), and the Outline Viewer (choose which passages to include in an outline section). Alt.Text is under active development, and is available for download in both Windows and OS X versions.
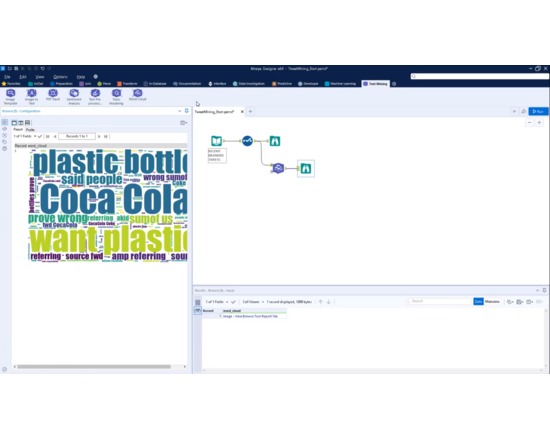
Alteryx is an online commercial data analysis service. Among its capabilities are optical character recognition, sentiment analysis, and topic modeling with Text Mining. You can quickly build predictive models without coding through its intuitive graphical user interface. It has many visualisation options among which is the word cloud.
The Altmetric Explorer is a powerful web app that allows you to track the conversations around scientific articles online. Altmetric collects and analyzes hundreds of thousands of postings about tens of thousands of articles and datasets each month. It makes this data available to end users through an intuitive user interface and to developers through an API. The Altmetric score is their quantitative measure of the attention that a scholarly article has received and is derived from volume (the frequency of mentions, but only from an individual source), sources (the category of mentions are ranked: tweets, newspaper mentions, etc. and are given weights), and authors. A browser button is available for download for free and can be used on any article to determine the piece's score.
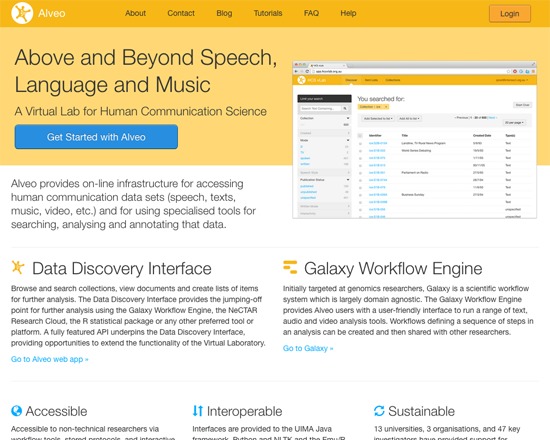
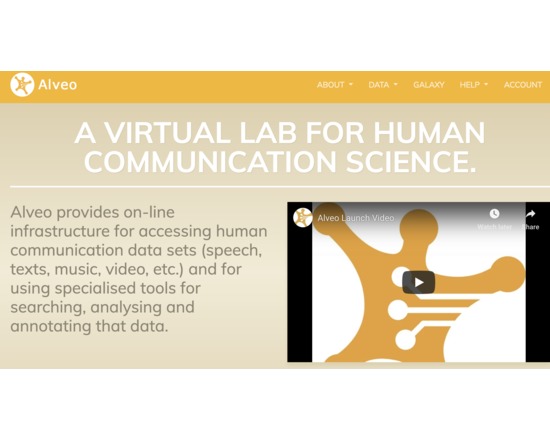
Alveo is a platform for data discovery and analysis focused on communication data such as speech, text or video. Developed by the University of Western Sydney, researchers can use the Alveo infrastructure to store data, create collections, develop workflows, and analyze datasets with Alveo's built-in tools. The tools available span multiple disciplines and include common functions such as tokenization and concordance, plus interfaces between Alveo and other common analysis tools such as Apache's UIMA for NLP, and with programming languages such as Python and Java. Users can segmented and recombined data from multiple collections into a new, focused dataset for close analysis. Collection creators can set their own license and access rights, and users of a collection must accept the creator's conditions in order to use data from it. User accounts are free, but must be requested from and approved by Alveo.
This is the project website for Alveo: Above and Beyond Speech, Language and Music, A Virtual Lab for Human Communication Science, a project funded by NeCTAR (National eResearch Collaboration Tools and Resources).
Amazon Comprehend is a natural language processing (NLP) service that uses machine learning to find insights and relationships in text. No machine learning experience required. There is a treasure trove of potential sitting in your unstructured data. Customer emails, support tickets, product reviews, social media, even advertising copy represents insights into customer sentiment that can be put to work for your business. The question is how to get at it? As it turns out, Machine learning is particularly good at accurately identifying specific items of interest inside vast swathes of text (such as finding company names in analyst reports), and can learn the sentiment hidden inside language (identifying negative reviews, or positive customer interactions with customer service agents), at almost limitless scale. Amazon Comprehend uses machine learning to help you uncover the insights and relationships in your unstructured data. The service identifies the language of the text; extracts key phrases, places, people, brands, or events; understands how positive or negative the text is; analyzes text using tokenization and parts of speech; and automatically organizes a collection of text files by topic. You can also use AutoML capabilities in Amazon Comprehend to build a custom set of entities or text classification models that are tailored uniquely to your organization’s needs.
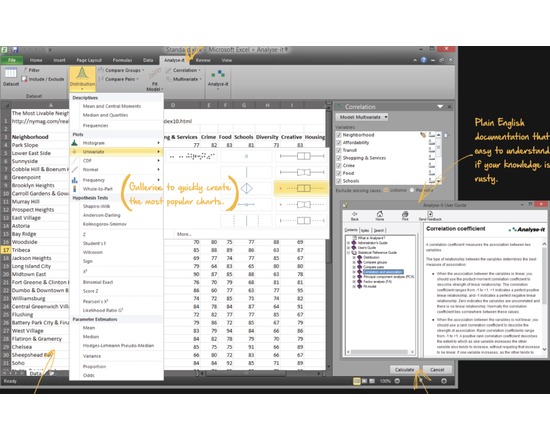
A set of dataset management and statistical plugins which is only available for Microsoft Windows including single and multiple linear regression, polynomial regression, and scatter plot with fit, fit confidence and prediction bands. The program can be used to generate visualizations and data reports. Requires Microsoft Excel.
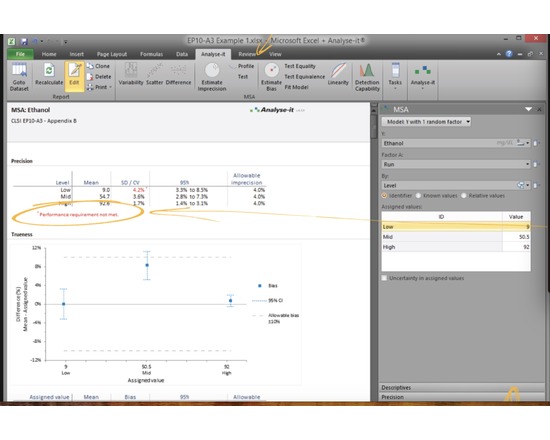
Analyse-it Method Validation Edition provides the statistical analysis you need to validate and verify analytical and diagnostic methods to meet the demands of regulatory compliance. With support for 11 CLSI protocols, it lets you: • Validate or verify analytical performance characteristics (precision, trueness, linearity, interferences, detection capability) of a measurement procedure to ensure they meet requirements for intended use or manufacturer's claims. • Compare methods to establish the real-world performance of a method against a reference method, or ensure comparability between two methods when making changes. Includes Deming, Weighted Deming, and Passing-Bablok regression, plus Bland-Altman limits of agreement. • Evaluate the diagnostic ability of a test to discriminate between two outcomes and compare test performance to find the most effective one. Includes ROC curves and Delong-Delong Clarke Pearson curve comparisons. • Establish a reference interval for a population of healthy individuals, or verify that existing intervals are transferable between laboratories or measurement procedures. Includes normal, quantile, robust bi-weight quantile, bootstrapped quantile, & Harrell-Davis quantile reference ranges.
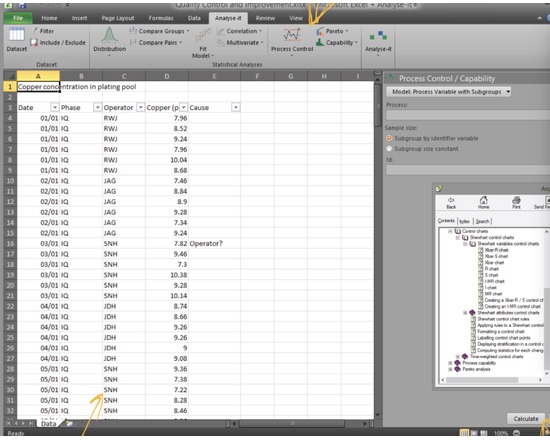
Analyse-it Quality Control & Improvement Edition provides the statistical analysis you need to understand processes, bring them under control, and find improvements that better your product. • Bring processes under statistical control so they are stable and predictable with powerful Shewhart, cumulative sum, and moving average control charts. Include Xbar-R, Xbar-S, R, S, I-MR, time weighted CUSUM, UWMA, EMA plots, and WECO, Nelson, Montomery or custom rulesets. • Ensure products are capable of meeting end-user specifications using capability indices to compare in-control process performance to your specification limits. • Improve processes and products by identifying solutions that really work using hypothesis tests and model fitting techniques. Includes ANOVA with multiple comparison, multiple linear and logistic regression, PCA and Factor analysis. • Identify actions that will reap the most rewards using Pareto analysis to identify commonly occurring defects and monitor them during process improvement.