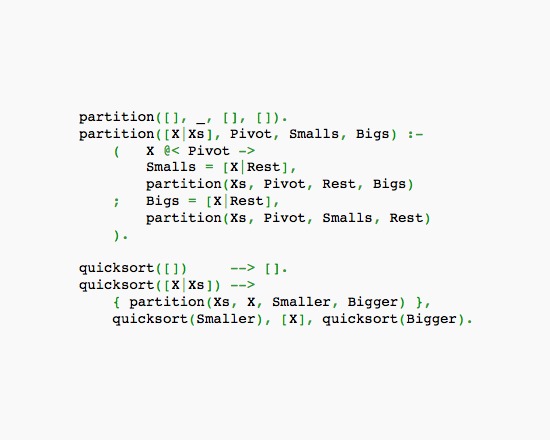
Prolog is a general purpose programming language first developed in the early 1970s with a particular value to computational lingusitics. Within the humanities, it was applied to natural language processing.
LISP is a longstanding high-level programming language first developed in the late 1950s. Within the humanities, it was applied to computational linguistics and natural language processing research.
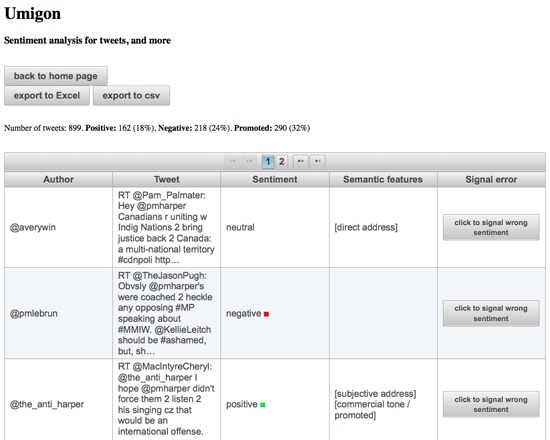
Umigon is a tool used for the sentiment analysis of texts. It is one of the tools of the Nocode app which is a suite of text analysis tools. Results can be exported in Excel or CSV format for further analysis. It was formerly a stand alone web-based and open-source tool for the sentiment analysis of tweets. From a person's Twitter handle, Umigon retrieved that account's tweets and processed them for sentiment while accounting for factual statements (ex: "I hate war" will be classified has negative, and "war in Syria" will be classified as neutral). Tweets could also be pasted manually in the entry box provided. Beyond sentiment analysis, Umigon could identify characteristics such as whether the tweet contains a question, whether it contains possible promotional/commercial subject matter, or temporal indicators based on tense. The developer of this application can be reached on Twitter. As of April 2022, Umigon has been archived after a long period without new developments.
Discursis is a tool for analyzing text-based natural language with a focus on sequential analysis. It is particularly desgined to work with texts that have an internal temporal structure, such as a transcribed conversation. For each text, it generates a statistics-based internal language model and applies tagging to each temporal unit detected. The model and tagging are then used as the basis for an interactive visualization which permits examination at a various levels of granularity, ranging from a whole-text to a unit-by-unit level; it can also show topic usage patterns within the text. Users must purchase a license; both student and academic trial licenses are available.
Leximancer is an application for identifying key concepts in a text, and exploring the results through interactive visualizations and data exports. It includes concept and network cloud visualizations, a sentiment lens, a query system, and multiple data export options for futher analysis. The system accepts texts in a variety of formats including plain text, CSV, HTML and XML, and supports 17 languages beyond English. Users can either purchase a license for the desktop version (Windows and OS X supported), or purchase access to the online LexiPortal, which charges based on months of usage rather than on a subscription basis. A free trial of the LexiPortal is also available.
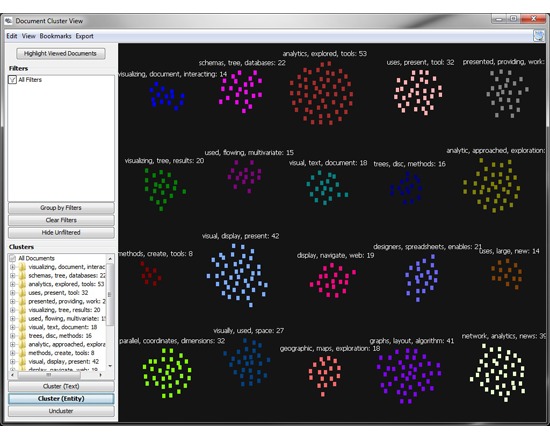
Jigsaw is a free visual analytics application for exploring collections of documents such as text or spreadsheets. It is aimed at analysists and researchers, particularly to "help analysts reach more timely and accurate understandings of the larger stories and important concepts embedded throughout textual results" via a collection of visualizations representing aspects such as important entities and their interconnections. The visualizations include graph, temporal and connections-based, and can be viewed on a document or corpus level.
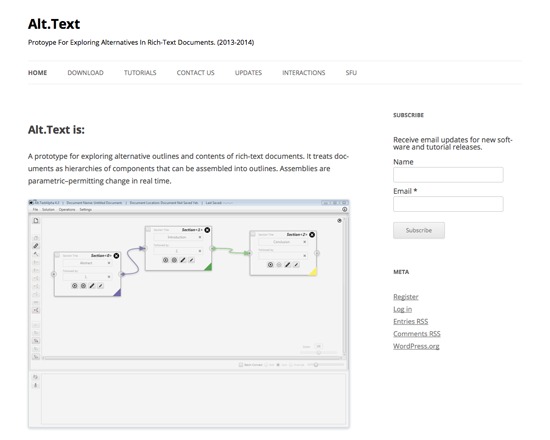
Alt.Text is a free, working prototype application for exploring a text on both an outline and content level via a graphical user interface. It breaks down texts into components such as sections, passages or documents, and permits users to leverage these components to create outlines and break off sections. Alt.Text includes three interfaces: the Document Editor (define sections, create outlines), the Section Editor (define passages of text within a given section), and the Outline Viewer (choose which passages to include in an outline section). Alt.Text is under active development, and is available for download in both Windows and OS X versions.
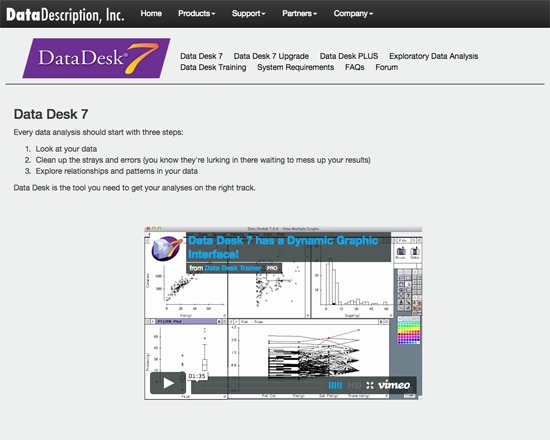
Data Desk is a commercial application for data exploration, analysis and visualization available for both OS X and Windows systems. It uses a graphical user interface to provide numerous tools for working with data, and can generate several distinct views. Notably, the program is designed from an exploratory rather than inferential analysis perspective. An academic license is available for users with a .edu email address; academic users without a .edu address can purchase by contacting Data Description, Inc. directly. A trial license is also available.
Dataplot is a free software system for data analysis, including characterization, visualization and modelling. It was developed in FORTRAN 77, and has been in continuous development since 1978. Dataplot is well-documented, with numerous tutorials for using and extending it. In addiiton, over 30 graphic types are supported, such as histograms, box plots, scatter plots and normal probability plots. This tool is currently available in Unix, Linux, OS X and Windows versions. Dataplot is open source, but is trademarked rather than licensed.
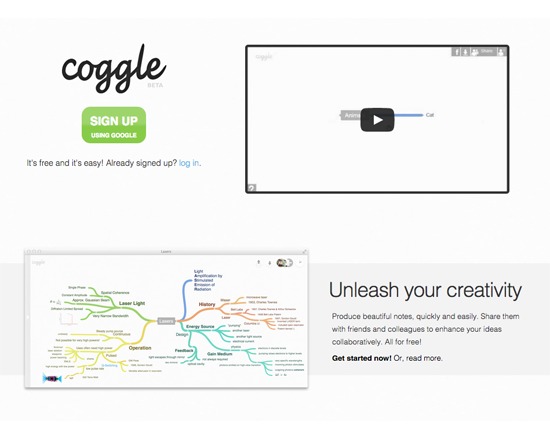
Coggle is a web-based tool for visualizing and applying non-linear structuring to information. Though Coggle has been used for mind mapping, it is primarily a method of documenting branching and non-linear information, and encompassing multiple perspectives. It utlizes a drag and drop interface for integrating images, permits multiple users to edit at the same time without causing data conflicts, and supports Markdown and LaTeX formatting. Coggle diagrams can be interlinked, branches of one diagram can be spawned off into its own diagram connected back to the original, and individual branches can be linked via hashtags. The tool includes an API that permits users to interface their diagrams with other programs and manupulate or examine them, and diagrams can also be exported in various formats such as plain-text outline, vector PDFs or images. Coggle is free except where users require more than 100 monthly active users or a closed source version.