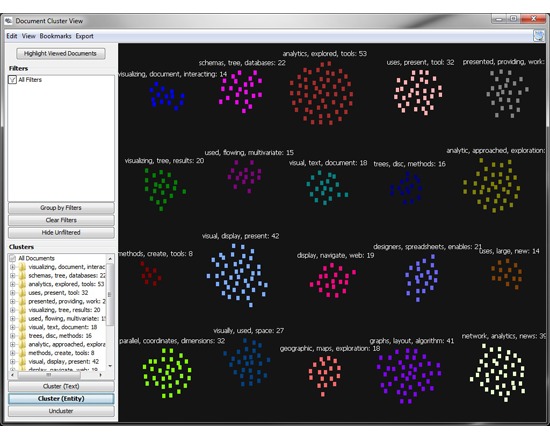
Jigsaw is a free visual analytics application for exploring collections of documents such as text or spreadsheets. It is aimed at analysists and researchers, particularly to "help analysts reach more timely and accurate understandings of the larger stories and important concepts embedded throughout textual results" via a collection of visualizations representing aspects such as important entities and their interconnections. The visualizations include graph, temporal and connections-based, and can be viewed on a document or corpus level.
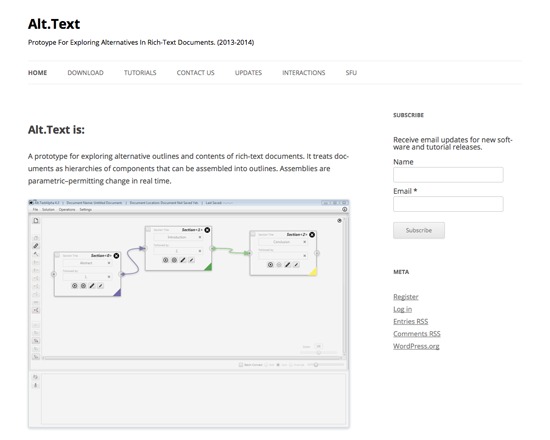
Alt.Text is a free, working prototype application for exploring a text on both an outline and content level via a graphical user interface. It breaks down texts into components such as sections, passages or documents, and permits users to leverage these components to create outlines and break off sections. Alt.Text includes three interfaces: the Document Editor (define sections, create outlines), the Section Editor (define passages of text within a given section), and the Outline Viewer (choose which passages to include in an outline section). Alt.Text is under active development, and is available for download in both Windows and OS X versions.
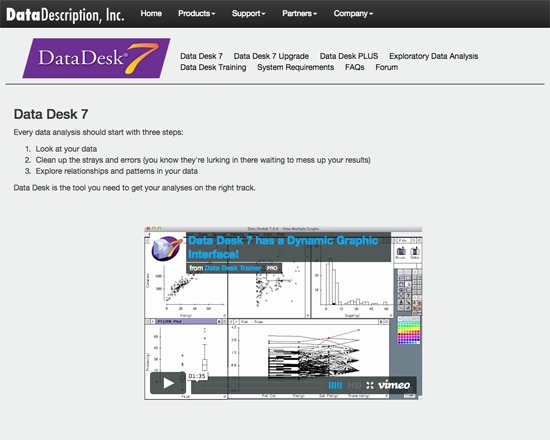
Data Desk is a commercial application for data exploration, analysis and visualization available for both OS X and Windows systems. It uses a graphical user interface to provide numerous tools for working with data, and can generate several distinct views. Notably, the program is designed from an exploratory rather than inferential analysis perspective. An academic license is available for users with a .edu email address; academic users without a .edu address can purchase by contacting Data Description, Inc. directly. A trial license is also available.
Dataplot is a free software system for data analysis, including characterization, visualization and modelling. It was developed in FORTRAN 77, and has been in continuous development since 1978. Dataplot is well-documented, with numerous tutorials for using and extending it. In addiiton, over 30 graphic types are supported, such as histograms, box plots, scatter plots and normal probability plots. This tool is currently available in Unix, Linux, OS X and Windows versions. Dataplot is open source, but is trademarked rather than licensed.
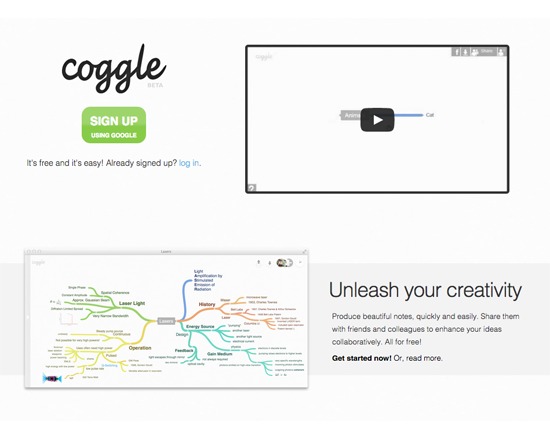
Coggle is a web-based tool for visualizing and applying non-linear structuring to information. Though Coggle has been used for mind mapping, it is primarily a method of documenting branching and non-linear information, and encompassing multiple perspectives. It utlizes a drag and drop interface for integrating images, permits multiple users to edit at the same time without causing data conflicts, and supports Markdown and LaTeX formatting. Coggle diagrams can be interlinked, branches of one diagram can be spawned off into its own diagram connected back to the original, and individual branches can be linked via hashtags. The tool includes an API that permits users to interface their diagrams with other programs and manupulate or examine them, and diagrams can also be exported in various formats such as plain-text outline, vector PDFs or images. Coggle is free except where users require more than 100 monthly active users or a closed source version.
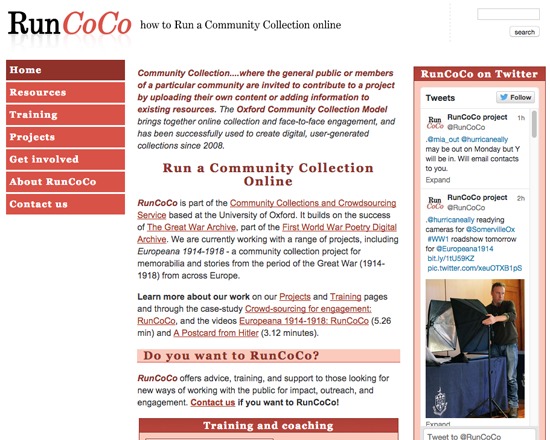
Community Contributed Collection (CoCoCo) is web software developed by the RunCoCo Project at the University of Oxford for collecting, cataloguing and managing web content such as text or uploaded files contributed by a community of users. It enables administrators to assess contributions for quality, approve project-appropriate contributions, and apply metadata where required. Once a contribution is approved, it is available for searching and browsing through the provided interface. CoCoCo utilizes Ruby on Rails, and is available under an Open Source version 3.0 license.
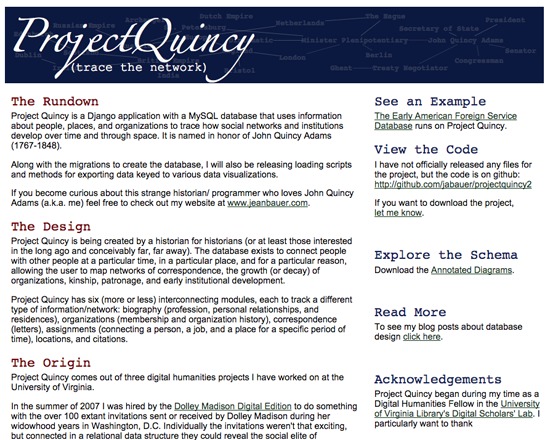
Project Quincy is a free, open source Django application and MySQL database for tracing the development of social networks and instititions across time and space. Aimed at historians, it enables users to map networks in historical documentation such as biographic, organizational, correspondance or location. Creator Jean Bauer has developed Project Quincy as a single generalizable and extensible database with applications beyond mapping historic connections. All code is available via Github repository, or by contacting the creator directly.
Lexos is a free, web-based workflow for text analysis offered by Wheaton College's Lexomics Project. Lexos is the most recent and distinct iteration of the Lexomics system of tools, enabling users to upload a text and use the Lexos interface to apply transformations, visualizations, scrubbing and analytic processes without needing to re-add the text for each step.
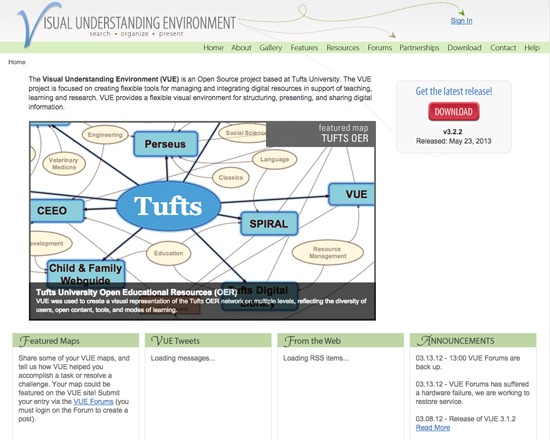
Visual Understanding Environment (VUE) is a free, open source application for mapping concepts, ideas and digital content. It enables users to generate nodes and links, and apply a simple set of tools to explore the relationships. VUE is, in the words of its developers, an application to "integrate, organize and contextualize electronic content" in research or learning environments. Its tools include visualization, dynamic content mapping, semantic mapping, enhanced pathways and search functions.
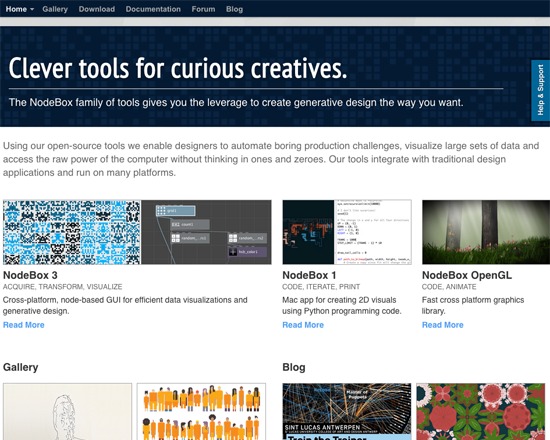
NodeBox is an open-source package of tools that includes the capacity to visualize large data sets. It utilizes interconnected nodes to generate and manipulate data visualizations, and can import data either from common programs such as Excel, or from custom user-developed importers.