With ediarum researchers can comfortably transcribe, encode and edit manuscripts in TEI-XML, as well as publish their results in an online or print edition. The solution, developed by TELOTA, is based on three software components: exist-db, Oxygen XML Author, and ConTeXt. These are combined, supplemented with additional functions, and tailored to fit a project's needs.
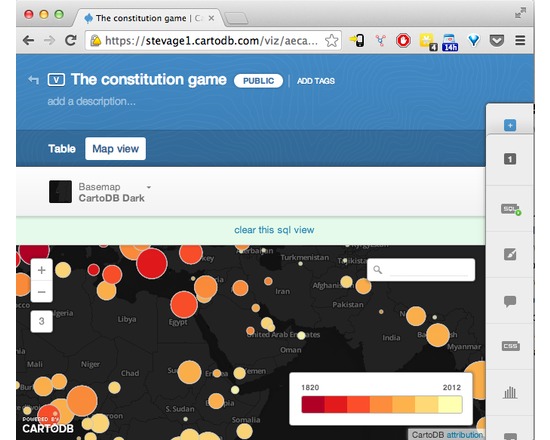
CartoDB makes data-driven map visualisation tool. It's very easy to upload a couple of spreadsheets of data, with latitudes and longitudes or addresses, and turn them into clickable markers on maps. There are several types of pre-canned visualisation, such as categories, choropleths or even animated "torque" maps. It's also a sophisticated platform allowing complex visualisations to be built up using Javascript and the CartoDB API.
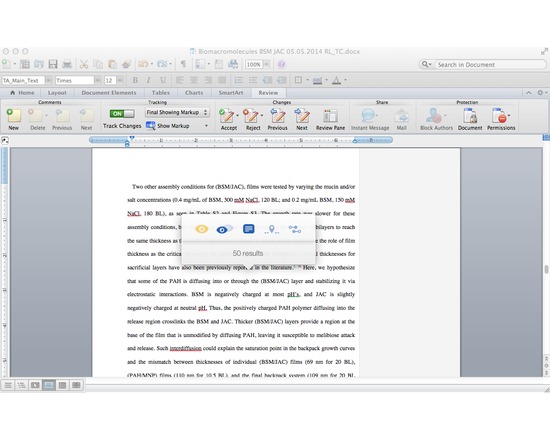
Writefull is a light-weight app that uses data from Google Books (5+ million books) and the Web to improve your writing, It compares small sections of your text to a large data set of writing found online and in Google Books. All you need to do is select a chunk of your text in your browser or text editing software, activate the Writefull popover, and choose one of its five options: 1) check the number of results (how often the chunk appears in Google Books or the Web); 2) compare the number of results (if your selected chunk appears more or less frequently than suggestions from online); 3) see examples in context (display several examples of how your selected chunk is used in different texts); 4) find words in context (see which words are used most often in your context, which you specify in your text by a star. For example, 'research should * this issue' will give you a list with 'research should address this issue', 'research should explore this issue', 'research should examine this issue', etc.); 5) find synonyms in context (see which synonyms of a word are used most often in your context, with you specifying the word you want synonyms for by two stars. For example: 'a *difficult* situation' will suggest 'an awkward situation', 'a serious situation', 'an embarrassing situation', etc). The app works with a small popover which mean you can activate it from whatever writing tool you're using. No need to change windows - no interruption of your workflow. N.B. Writefull 2.0 will be launching soon and will eliminate the need to purchase queries in the Web version. The $5 membership fee still applies.
Overleaf, previously known as WriteLaTeX, is a free service that lets users create, edit and share their scientific ideas easily online using LaTeX, a comprehensive and powerful tool for scientific writing. Users can start projects with quality LaTeX templates for journals, CVs, resumes, papers, presentations, assignments, letters, project reports, and more.
Geographically Encoded Objects for RSS feeds. GeoRSS was designed as a lightweight, community driven way to extend existing feeds with geographic information. As RSS and Atom become more prevalent as a way to publish and share information, it becomes increasingly important that location is described in an interoperable manner so that applications can request, aggregate, share and map geographically tagged feeds.RSS Map of Digital Humanities centers Two primary GeoRSS encoding exist, including GeoRSS Geography Markup Language (GML) and GeoRSS Simple. GeoRSS-Simple is a lightweight format that supports basic geometries of point, line, box, polygon. GeoRSS GML is a Open Geospatial Consortium (OGC) GML Application Profile, and supports a greater range of features than GeoRSS Simple.
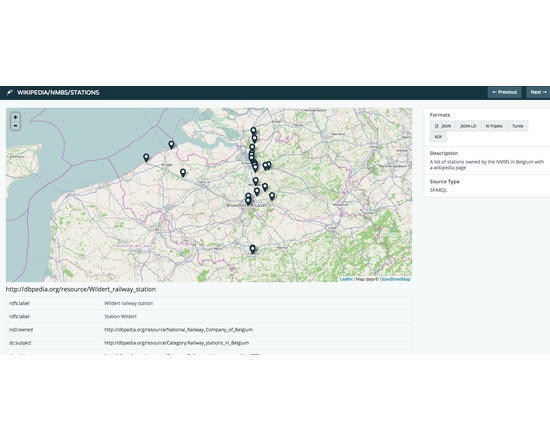
The DataTank is an open source tool that publishes data, stored in text-based files (e.g., CSV, XML, JSON) or in binary structures (e.g., SHP files, relational databases). The DataTank reads data from these structures and publishes them to the web using a URI as an identifier, providing these data in any format a user wants regardless of the original data structure. The DataTank requires a server with Apache2 or Nginx, mod rewrite enabled, PHP 5.4 or higher, Git, any database supported by Laravel 4. Features Turn any dataset into a RESTful HTTP API Allows published data to be requested in any web-readable format or visualization Improves the ease, openness, and transparency of data consumption Enables data consumers to immediately begin working, without needing to download raw data files Provides visualizations for immediate data interpretation and information gathering by civilians Resources The DataTank demo Documentation GitHub
A platform for visualizing and analysing networks of historical data. Palladio is web-based tool that allows a user to upload structured data, graphically establish context within Palladio and then choose from a variety of innovative spatial, temporal and network visualisations to analyse and present research findings.
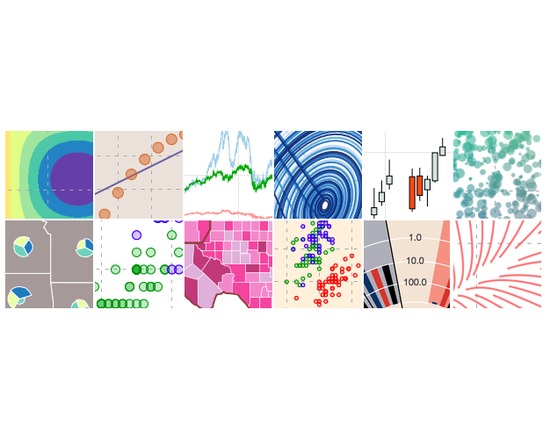
Bokeh is a Python interactive visualization library for large datasets that natively uses the latest web technologies. Its goal is to provide elegant, concise construction of novel graphics in the style of Protovis/D3, while delivering high-performance interactivity over large data to thin clients.
A powerfully simple eLearning authoring tool, ProProfs eLearning Software is ideal for the creation of online trainings or educational programs. Easy to use and extremely effective, ProProfs authoring tool can be used by educators and trainers alike to create high-quality courses and assessments that can be accessed anytime and from anywhere in the world. The eLearning software makes it easy for companies to save time and money by scheduling online training sessions for a team that may be spread across the world. Similarly, educational institutions can also benefit with by making and delivering online courses to students from across the globe. Key Features of ProProfs eLearning Software Create courses using existing PDFs & presentations Test understanding with quizzes & assessments Collect feedback with surveys & polls Advanced reporting and analysis Earn by selling your courses
(from web page) Augmented Notes integrates scores and audio files to produce interactive multimedia websites in which measures of the score are highlighted in time with music. To get started making your own website, upload mp3 and ogg versions of your audio file, images of the pages of your score, and, if you have one, an MEI file containing measure boundaries, then hit submit below. Augmented Notes will help you mark the measures on the score and assign them times, and will output a zip file of everything you need to have your own website.