Skip to content
TAPoR Text Analysis Portal for Research

Tools

Sort by Name Rating ↑ Date

Content Analysis

Korbo

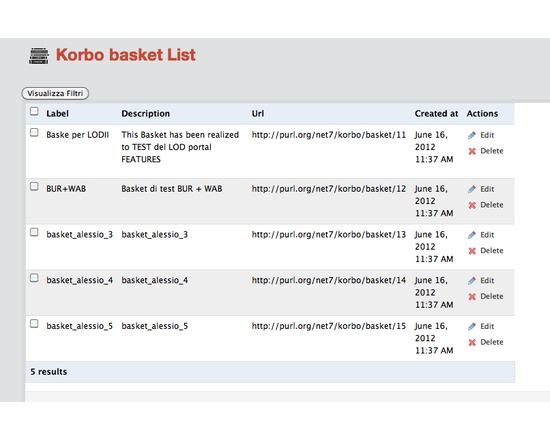
Korbo is a powerful aggregation platform for gathering Linked Data objects relevant to your area of research into single workspaces or “baskets”. Korbo is targeted primarily at developers who want to build applications on top of its API and make full use of the linked cultural data from sources such as Europeana, FreeBase and DBPedia. Korbo is currently in the early stages of development, but you can already try out a demo version of the platform.

Rated 0.0 out of 5.

Visualization

TileMill

Open source map design studio for creating and styling web tile maps, based on either provided free MapBox Geodata, or data imported as a variety of file formats. It uses the CartoCSS styling language to customize interactive visualizations, with powerful control of symbols, zoom levels, labels, and other cartographic details. The finished maps can be exported either as images or tiled web maps. Though the TileMill software is free, there may be a fee to host the created tiles on MapBox or elsewhere.

Rated 0.0 out of 5.

Visualization

visual.ly

Easy-to-use web-based software for creating infographics and data visualization, including a platform to share your work and discover works by others.

Rated 0.0 out of 5.

Dissemination

Piazza

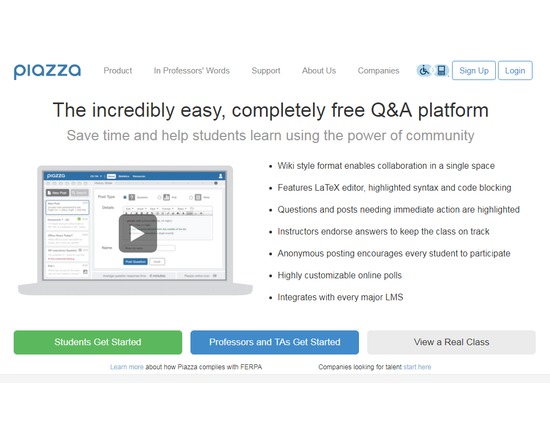
Web-based discussion tool (not a full-fledged learning management system, but you can link to Piazza from your LMS, including Blackboard, Moodle, and Coursera) that allows student to ask questions and interact with instructors and other students in a public space. A wiki style format enables collaboration in a single space and features LaTeX editor, highlighted syntax and code blocking. Questions and posts needing immediate action are highlighted and instructors endorse answers to keep the class on track. Anonymous posting encourages every student to participate. Subjects include computer science, biology, chemistry, economics, psychology, engineering, mathematics, and physics. Once in a subject area, you can view what professors from where are teaching or answering questions on what. This is a great tool for students looking to get extra or more in-depth help beyond the classroom. Companies can use Piazza for recruiting college students, and it is this function for which users pay.

Rated 0.0 out of 5.

Creation

Xtranormal

Easy-to-use web-based animation software. Offers educational pricing.

Rated 0.0 out of 5.

ScribTeX

Web based LaTeX editor that features a LaTeX complier, version control, and online storage space. Allows collaborative editing and offline editing.

Rated 0.0 out of 5.

Uncategorized

VirtualBox

VirtualBox is a general-purpose full virtualizer for x86 hardware, targeted at server, desktop and embedded use. For example, you can use a Windows computer to create a Mac or Linux environment to test software or websites.

Rated 0.0 out of 5.

Gathering

Pocket

Pocket was founded in 2007 by Nate Weiner to help people save interesting articles, videos and more from the web for later enjoyment. Once saved to Pocket, the list of content is visible on any device — phone, tablet or computer. It can be viewed while waiting in line, on the couch, during commutes or travel — even offline.

Rated 0.0 out of 5.

Creation

Google Drive

Available as a web-based service and as an app for iOS, Mac, PC, and Android, Google Drive allows users to create, store, edit, and share files across all their devices. Online and offline file access available. Requires a Google account for use, but allows files from Drive to be shared with non-Google users. Drive allows users to upload, store, and share any type of file (e.g., JPEG, MP4, JS, INDD, AI). The majority can be previewed, and many can be edited within Drive. Some files (e.g., DOCX, XLSX, PPTX) can be converted into compatible file types for editing, commenting, and more. Drive is the platform for Google Sheets, Docs, Slides, and many other approved applications. Files saved in Drive sync to all other devices, with an activity monitor that can be useful for version control (see what edits have been made and when, and revert back to previous instances if needed). Offers both free and paid accounts, priced by data capacity: 15 GB (free), 100 GB ($1.99/month), 1 TB ($9.99/month), 10 TB ($99.99/month), 20 TB ($199.99/month), 30 TB ($299.99/month). Teams with more than five people can purchase unlimited storage for $10/user/month.

Rated 0.0 out of 5.

Visualization

Sci2 Tool

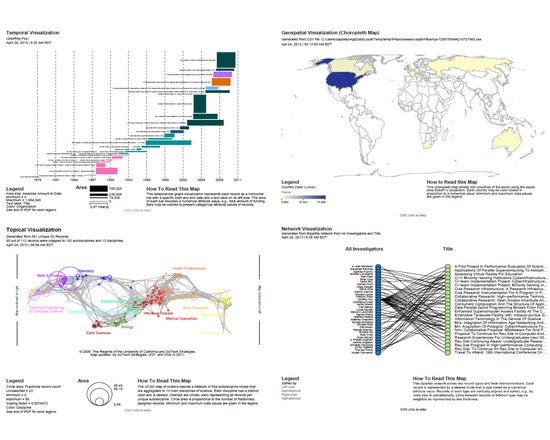
The Science of Science (Sci2) Tool is a modular toolset supporting temporal, geospatial, topical, and network analysis and visualization of datasets at the micro (individual), meso (local), and macro (global) levels. Users of the tool can: Access science datasets online or load their own Perform different types of analysis with the most effective algorithms available Use different visualizations to interactively explore and understand specific datasets Share datasets and algorithms across scientific boundaries

Rated 0.0 out of 5.