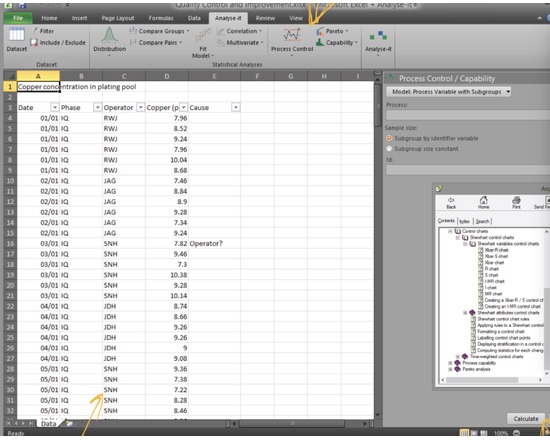
Analyse-it Quality Control & Improvement Edition provides the statistical analysis you need to understand processes, bring them under control, and find improvements that better your product. • Bring processes under statistical control so they are stable and predictable with powerful Shewhart, cumulative sum, and moving average control charts. Include Xbar-R, Xbar-S, R, S, I-MR, time weighted CUSUM, UWMA, EMA plots, and WECO, Nelson, Montomery or custom rulesets. • Ensure products are capable of meeting end-user specifications using capability indices to compare in-control process performance to your specification limits. • Improve processes and products by identifying solutions that really work using hypothesis tests and model fitting techniques. Includes ANOVA with multiple comparison, multiple linear and logistic regression, PCA and Factor analysis. • Identify actions that will reap the most rewards using Pareto analysis to identify commonly occurring defects and monitor them during process improvement.
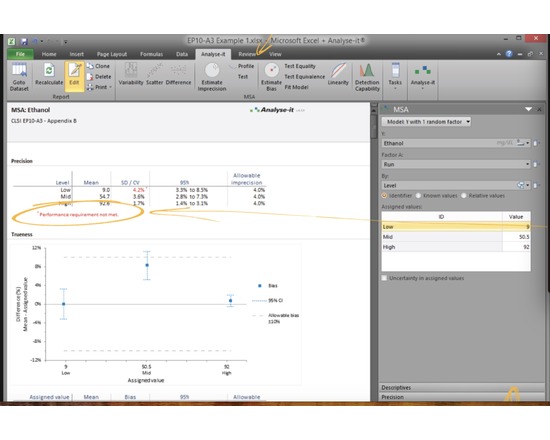
Analyse-it Method Validation Edition provides the statistical analysis you need to validate and verify analytical and diagnostic methods to meet the demands of regulatory compliance. With support for 11 CLSI protocols, it lets you: • Validate or verify analytical performance characteristics (precision, trueness, linearity, interferences, detection capability) of a measurement procedure to ensure they meet requirements for intended use or manufacturer's claims. • Compare methods to establish the real-world performance of a method against a reference method, or ensure comparability between two methods when making changes. Includes Deming, Weighted Deming, and Passing-Bablok regression, plus Bland-Altman limits of agreement. • Evaluate the diagnostic ability of a test to discriminate between two outcomes and compare test performance to find the most effective one. Includes ROC curves and Delong-Delong Clarke Pearson curve comparisons. • Establish a reference interval for a population of healthy individuals, or verify that existing intervals are transferable between laboratories or measurement procedures. Includes normal, quantile, robust bi-weight quantile, bootstrapped quantile, & Harrell-Davis quantile reference ranges.
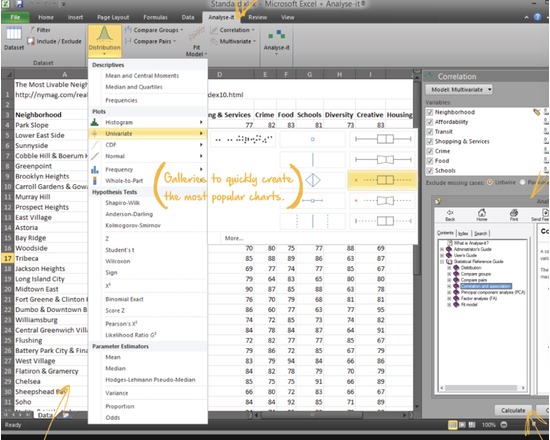
Analyse-it Standard Edition provides you with the powerful statistical analysis and regression you’d expect from an expensive statistics package, but without the complexity or the cost. • Describe your data with a wide range of statistics. • Visualize distributions, see trends and patterns, and spot outliers with powerful charts from histograms to scatter plots. • Infer and test hypotheses to get answers on distribution parameters, differences between populations, association between variables, and much more. Includes ANOVA, multiple comparisons, and an extensive range of parametric and non-parametric tests. • Discover relationships between variables and identify important factors with powerful regression and model fitting techniques. Include linear and logistic regression, with simple functions, or advanced models with crossed, polynomial and factorial terms. • Get insight into highly complex data by reducing dimensionality to get a clearer picture of the underlying structure. Includes correlation matrix, PCA (Principle Component Analysis) and Factor Analysis.
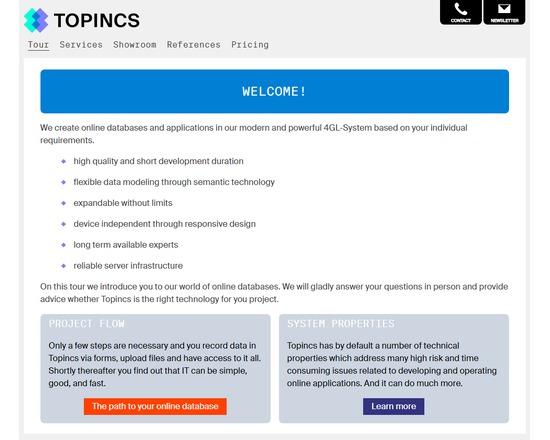
Topincs is a online database software. Given a data model, it allows data to be recorded and files to be uploaded and annotated through forms, data and files to be displayed and navigated through interconnected data sheets, and all that searched in the index. It overcomes the rigidity of relational databases by using semantic technology. In the simplest use case, a group of users can collaboratively edit information and upload files from any device with a web browser and an internet connection. Development time ranges between 1 and 8 hours. By designing and implementing services, the data can be manipulated, transformed and aggregated through an virtual object oriented programming interface driven by the data model. This allows sophisticated use cases where different user groups with different rights are presented a completely different application working on the same database. In these cases development time ranges between 2 and 20 days. A Topincs online database can be rented for a monthly fee. Topincs provide all services related to an online database: data modeling, programming, and support. They have special rates for educational institutions. Topincs can also be used as a Platform as a Service where the dark art of Topincs modeling and development must be studied online. The underlying semantic technology, Topic Maps, is taught there through hands on examples and will change your view on information technology.
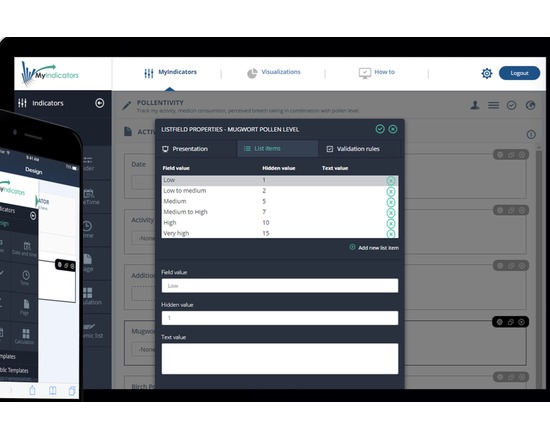
MyIndicators (http://myindicators.net/) is a digital, easy-to-use tool allows researchers, educators, students or anyone, to build their own tailored indicators (e.g. goals, strategies, parameters, survey, questions, calories intakes, alcohol consumptions or quantified self in terms of training, mood tracking or sleeping quality etc.) The tool can be used for data collection, data storage, data analysis, data visualisation and export data (excel spreadsheet format). Easier to detect the trend and keep track based on the visualisation and using real time data. There are free useful ready-made templates available for personal use. Besides research, education and quality industries, MyIndicators can be used by anyone who wishes to improve performance, achieve personal goals, promote healthy habits or gain personal insights. Educational and students discounts are available.
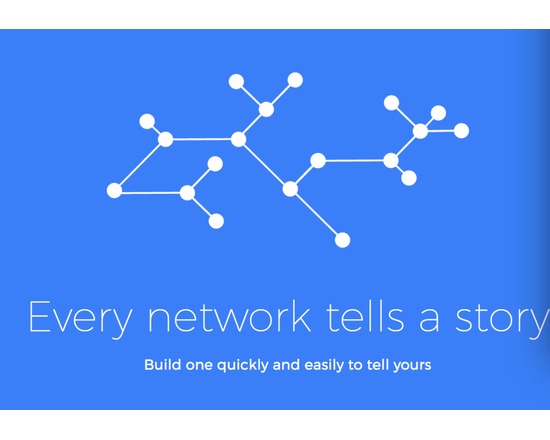
Onodo is a user friendly tool for doing basic visualisation and analysis within a browser making it cross-platform right out of the box. Data can be entered via their intuitive, in-browser node and edge creation tables or imported from a file. As data is added it is instantly previewed and displayed. The visual appearance can be tweaked on the fly and customised in a variety of ways (including applying a unique image or URL to each node). Once created, visualisations can be embedded and shared outside of the Onodo browser environment. Moreover, with a click of a button, Onodo calculates standard network parameters such as betweenness, closeness and displays these values within the table. It calculates and demonstrates basic network parameters and measures quickly and allows for the creation of chapters that cement using the visualisation as a data-driven narrative device.
The FAIMS Mobile Platform (http://www.fedarch.org) is an open source, generalised system for digital data collection on Android. It works offline and helps record free text, multimedia, structured or spatial data with ample opportunity for the capture of metadata and certainty components of the captured data. It needs to be customised (via an xml definition document) for particular field/lab workflows. As a server-client system it facilitates simultaneous operation by multiple users. It’s great for large teams operating in degraded network, or entirely offline, who need to generate consistent and complete digital datasets.
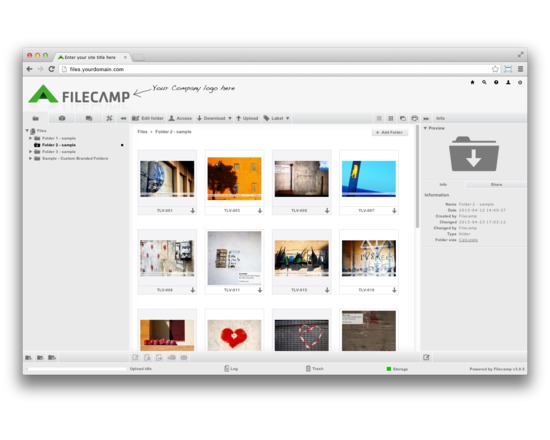
Online Digital Asset Management (DAM) and collaboration platform for business use. Offers user management, custom branding and password-protected folders. Digital Asset Management, Secure File Sharing, Media Library, Online Proofing and so much more … Upload, manage and share your files from one good looking, easy-to-use spot in the cloud.
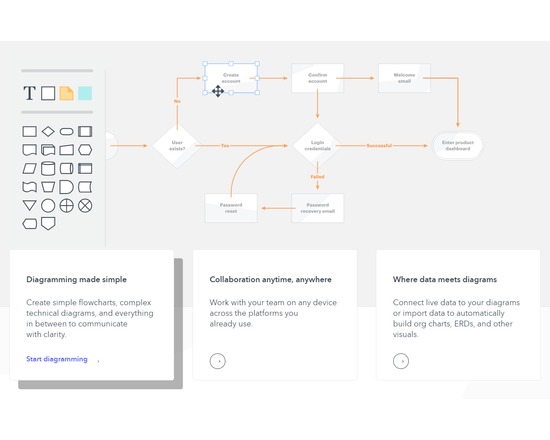
Lucidchart is an online diagram tool that enables users to easily visualize complex information through flow charts, mind maps and other diagram types. Multiple users can work together simultaneously to edit a document. Lucidchart integrates with many platforms including Google Apps/Drive, Confluence, JIRA, Slack, ec. Free accounts are provided for educational use.