140kit provides a management layer for tweet collection and analysis. Raw data cannot be passed through to the users, but any analytical process can be run across your dataset, and the data is held for as long as the user wants. When new analytical processes are created, they can be run on existing sets of data. 140kit does not claim any control of the analysis, however it retains ownership of the data collected. Current limits: User: 20,000 Tweets per Dataset or until Dataset time elapses Academic User: 500,000 Tweets per Dataset or until Dataset time elapses
The cross-platform Advene application allows users to easily create comments and analyses of video documents, through the definition of time-aligned annotations and their mobilisation into automatically-generated or user-written comment views (HTML documents). Annotations can also be used to modify the rendition of the audiovisual document, thus providing virtual montage, captioning, navigation... capabilities. Users can exchange their comments/analyses in the form of Advene packages, independently from the video itself. The Advene framework provides models and tools allowing to design and reuse annotations schemas; annotate video streams according to these schemas; generate and create Stream-Time Based (mainly video-centred) or User-Time Based (mainly text-centred) visualisations of the annotations. Schemas (annotation- and relation-types), annotations and relations, queries and views can be clustered and shared in units called packages. Hypervideo documents are generated when needed, both from packages (for annotation and view description) and DVDs (audiovisual streams).
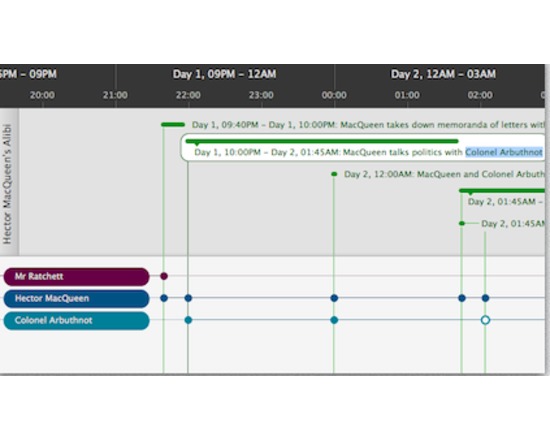
Aeon Timeline is more like an abstract temporal entity management program. I t happens to use a visual timeline, but it allows for conceptual linking of people, places, events in a rather clever fashion. It is intended for brainstorming and collecting via flexible input and export. With Aeon, you can divide your timeline into logical groups, projects, or concurrent arcs. You can model the relationships between events and people, places and ideas. Aeon calculates people's ages for you. And you can link your events with research material such as external files or images that can be displayed inside the application.
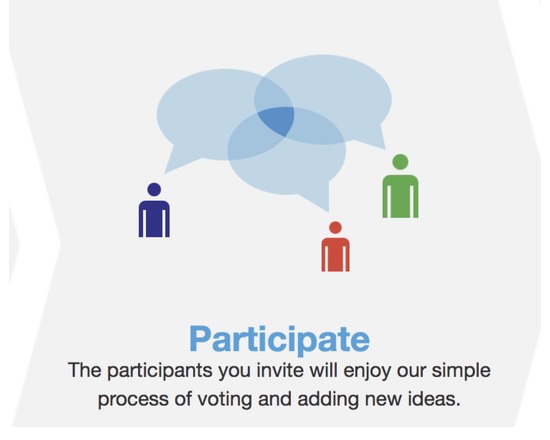
All Our Ideas is a research project that seeks to develop a new form of social data collection by combining the best features of quantitative and qualitative methods. Using the power of the web, we are creating a data collection tool that has the scale, speed, and quantification of a survey while still allowing for new information to "bubble up" from respondents as happens in interviews, participant observation, and focus groups.
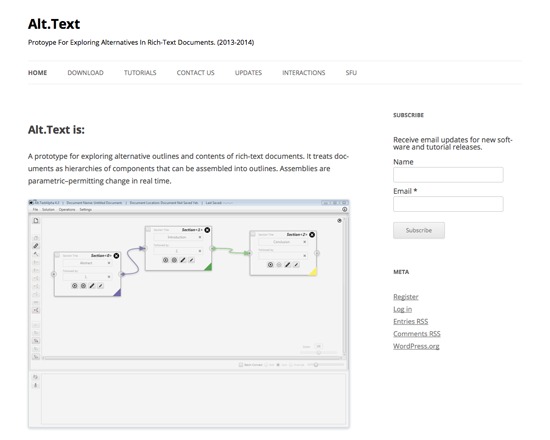
Alt.Text is a free, working prototype application for exploring a text on both an outline and content level via a graphical user interface. It breaks down texts into components such as sections, passages or documents, and permits users to leverage these components to create outlines and break off sections. Alt.Text includes three interfaces: the Document Editor (define sections, create outlines), the Section Editor (define passages of text within a given section), and the Outline Viewer (choose which passages to include in an outline section). Alt.Text is under active development, and is available for download in both Windows and OS X versions.
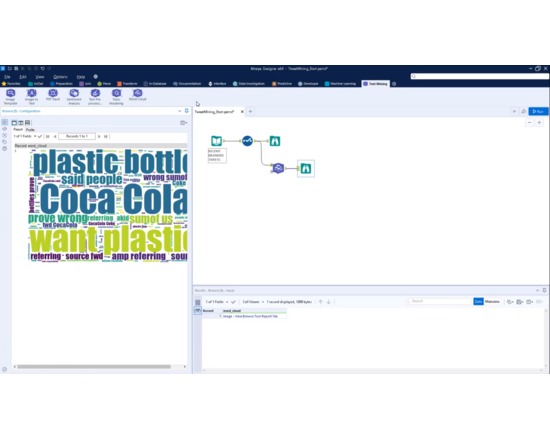
Alteryx is an online commercial data analysis service. Among its capabilities are optical character recognition, sentiment analysis, and topic modeling with Text Mining. You can quickly build predictive models without coding through its intuitive graphical user interface. It has many visualisation options among which is the word cloud.
A set of dataset management and statistical plugins which is only available for Microsoft Windows including single and multiple linear regression, polynomial regression, and scatter plot with fit, fit confidence and prediction bands. The program can be used to generate visualizations and data reports. Requires Microsoft Excel.
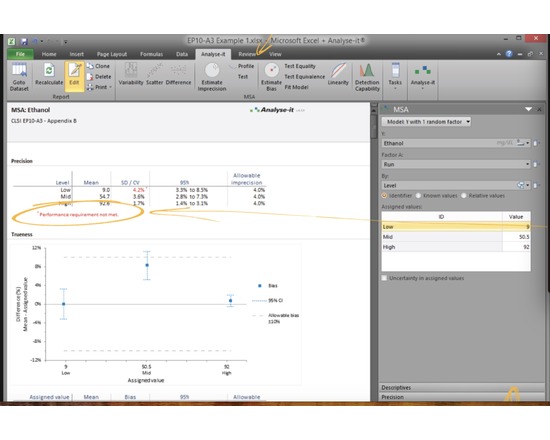
Analyse-it Method Validation Edition provides the statistical analysis you need to validate and verify analytical and diagnostic methods to meet the demands of regulatory compliance. With support for 11 CLSI protocols, it lets you: • Validate or verify analytical performance characteristics (precision, trueness, linearity, interferences, detection capability) of a measurement procedure to ensure they meet requirements for intended use or manufacturer's claims. • Compare methods to establish the real-world performance of a method against a reference method, or ensure comparability between two methods when making changes. Includes Deming, Weighted Deming, and Passing-Bablok regression, plus Bland-Altman limits of agreement. • Evaluate the diagnostic ability of a test to discriminate between two outcomes and compare test performance to find the most effective one. Includes ROC curves and Delong-Delong Clarke Pearson curve comparisons. • Establish a reference interval for a population of healthy individuals, or verify that existing intervals are transferable between laboratories or measurement procedures. Includes normal, quantile, robust bi-weight quantile, bootstrapped quantile, & Harrell-Davis quantile reference ranges.
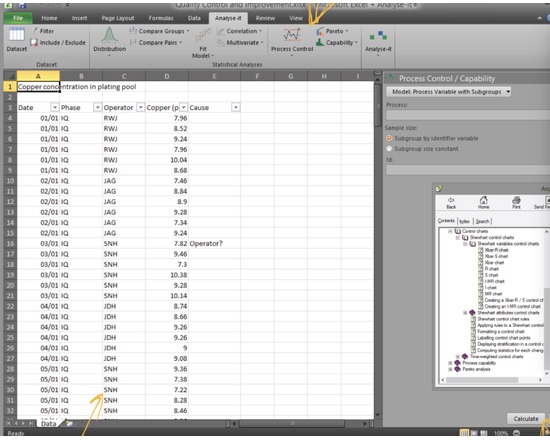
Analyse-it Quality Control & Improvement Edition provides the statistical analysis you need to understand processes, bring them under control, and find improvements that better your product. • Bring processes under statistical control so they are stable and predictable with powerful Shewhart, cumulative sum, and moving average control charts. Include Xbar-R, Xbar-S, R, S, I-MR, time weighted CUSUM, UWMA, EMA plots, and WECO, Nelson, Montomery or custom rulesets. • Ensure products are capable of meeting end-user specifications using capability indices to compare in-control process performance to your specification limits. • Improve processes and products by identifying solutions that really work using hypothesis tests and model fitting techniques. Includes ANOVA with multiple comparison, multiple linear and logistic regression, PCA and Factor analysis. • Identify actions that will reap the most rewards using Pareto analysis to identify commonly occurring defects and monitor them during process improvement.
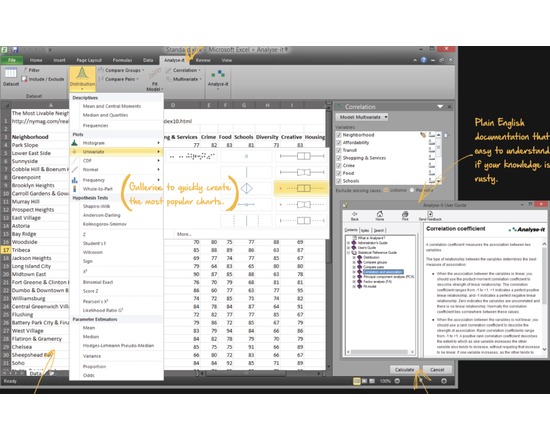
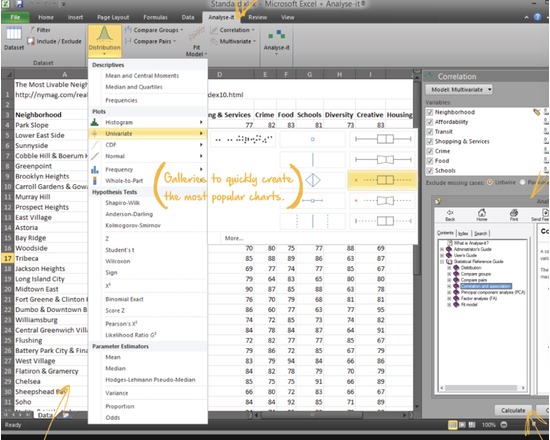
Analyse-it Standard Edition provides you with the powerful statistical analysis and regression you’d expect from an expensive statistics package, but without the complexity or the cost. • Describe your data with a wide range of statistics. • Visualize distributions, see trends and patterns, and spot outliers with powerful charts from histograms to scatter plots. • Infer and test hypotheses to get answers on distribution parameters, differences between populations, association between variables, and much more. Includes ANOVA, multiple comparisons, and an extensive range of parametric and non-parametric tests. • Discover relationships between variables and identify important factors with powerful regression and model fitting techniques. Include linear and logistic regression, with simple functions, or advanced models with crossed, polynomial and factorial terms. • Get insight into highly complex data by reducing dimensionality to get a clearer picture of the underlying structure. Includes correlation matrix, PCA (Principle Component Analysis) and Factor Analysis.