Skip to content
TAPoR Text Analysis Portal for Research

For researchers who work with text

Find a text analysis tool that fits the work.

TAPoR catalogues concordancers, annotators, topic models, stylometry packages, and visualization environments. Every record notes the platform, the license, and what the tool is actually good for.

  • Platform, license, and method on every record
  • Reviews from people who teach with the tools
  • Lists assembled around a course or a corpus

Browse tools

Filter by the type of analysis.

View all tools
‹

Analysis

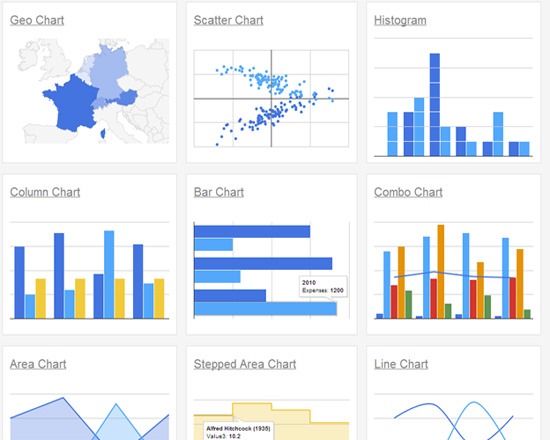
Google Charts

Google Charts (formerly the Google Visualization API) is a web-based interface for interactive data visualization via HTML5 and SVG. It includes a number of preset chart types ranging from line charts to word trees and all are customizable. A separate selection of user community contributed chart types is also available. Within a chart, the API identifies events that users can trigger with presets ranging from simple clicks to Javascript methods, and enable users to construct chart dashboards that can be embedded in their website along with the chart proper.
Rated 0.0 out of 5.

Analysis

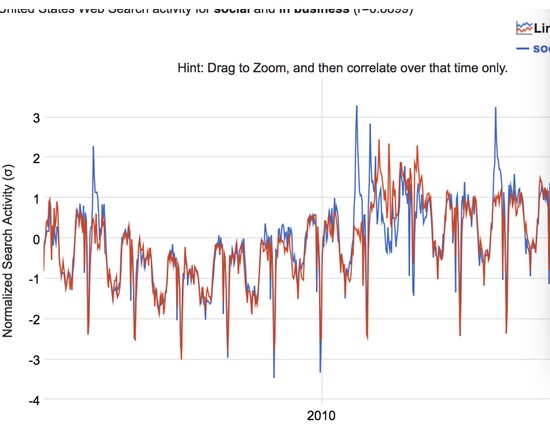
Google Correlate

Find searches that correlate with real-world data: Google Correlate finds search patterns which correspond with real-world trends.

Rated 0.0 out of 5.

Analysis

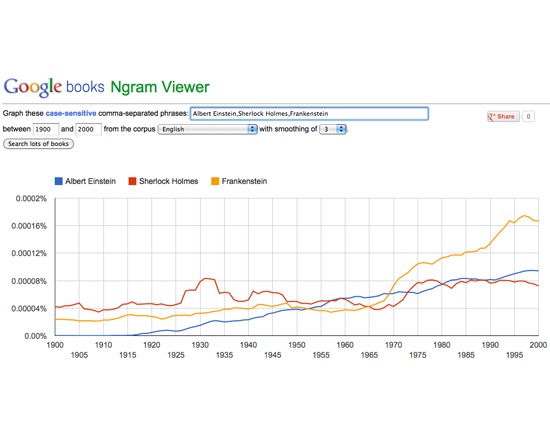
Google Ngram Viewer

The Google Ngram Viewer is a free, web-based tool affiliated with Google Books. It displays a graph showing how a set of user-supplied phrases have occurred in a corpus of books over a selection of years. The tool includes functions for part-of-speech tagging, ngram compositions and word dependencies, to name a few.

Rated 0.0 out of 5.

Analysis

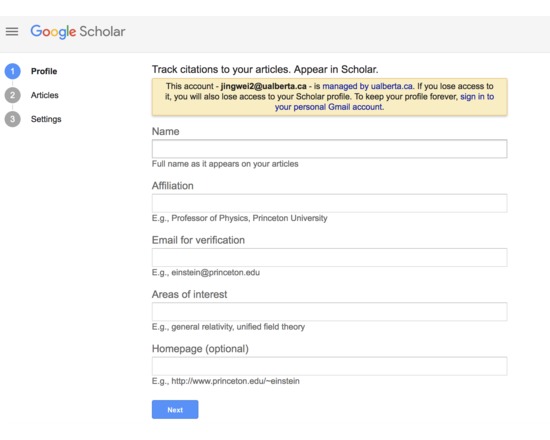
Google Scholar Citations

Google Scholar Citations lets you track citations to your publications, check who is citing your publications, graph your citations over time, compute citation metrics, and view publications by colleagues.

Rated 0.0 out of 5.

Analysis

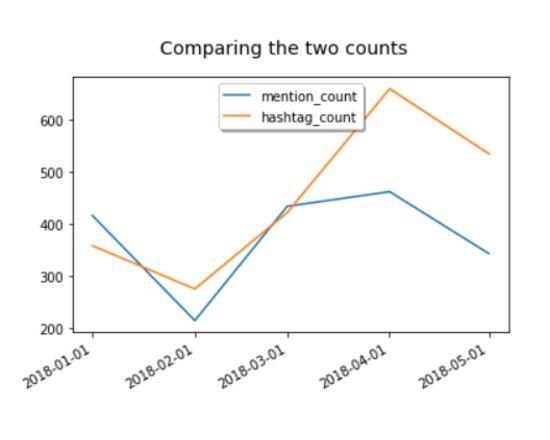
Graphing Twitter Data

TATR: Graphing This notebook is part of a greater series of Juypter Notebook structured around Twitter Tweet analysis. This particular notebook will look at graphing. From saving the resulting graph to organization. This notebook will provide the a framework that can be expanded to suit your needs.

Rated 0.0 out of 5.

Analysis

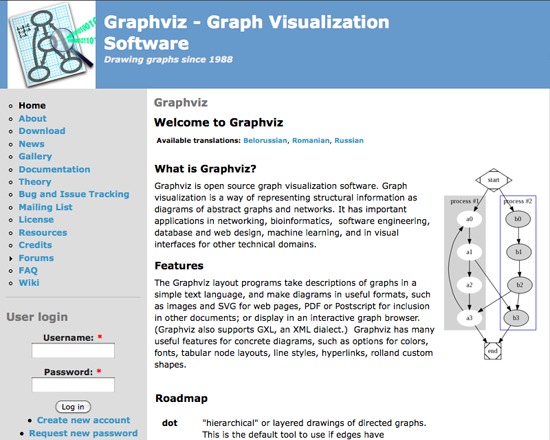
Graphviz

Graphviz is a free, open source graph visualization tool in constant development since 1988. It represents structural information as diagrams of abstract graphs and networks.

Rated 0.0 out of 5.

›

Curated lists

Curated list created by experience authors in the fields.

All curated lists

Geoffrey Rockwell

Cool Voyant Tools

Not all Voyant tools show up in the default view or skin. Here is a list of some of the other tools worth trying.

4 tools

View list

Holly Pickering

Audio Production Software

Interested in audio production and editing? Here are a few programs that can help you get on your way. Some of them are free, some not, but all are helpful and useful.

3 tools

View list

Jason Bradshaw

TATR: Text Analysis for Twitter Research

This list compiles a suite of tools that make up Kynan Ly's Text Analysis for Twitter Research (TATR) Library. Recipes to these notebooks can be found on methodi.ca

6 tools

View list

The catalogue

  • 1321

    Tools catalogued

  • 15

    Curated lists

  • 22

    Analysis types

  • 671

    Community reviews

More is coming

Researchers, power users, and students will soon be able to contribute tools, share reviews, and curate lists around their own work.