Skip to content
TAPoR Text Analysis Portal for Research

For researchers who work with text

Find a text analysis tool that fits the work.

TAPoR catalogues concordancers, annotators, topic models, stylometry packages, and visualization environments. Every record notes the platform, the license, and what the tool is actually good for.

  • Platform, license, and method on every record
  • Reviews from people who teach with the tools
  • Lists assembled around a course or a corpus

Browse tools

Filter by the type of analysis.

View all tools
‹

Analysis

Highcharts

Highcharts is a battle-tested SVG-based, multi-platform charting library that has been actively developed since 2009. It makes it easy to add interactive, mobile-optimized charts to your web and mobile projects. It features robust documentation, advanced responsiveness and industry-leading accessibility support.
Rated 0.0 out of 5.

Analysis

Humanists Natural Language Processing Cookbook

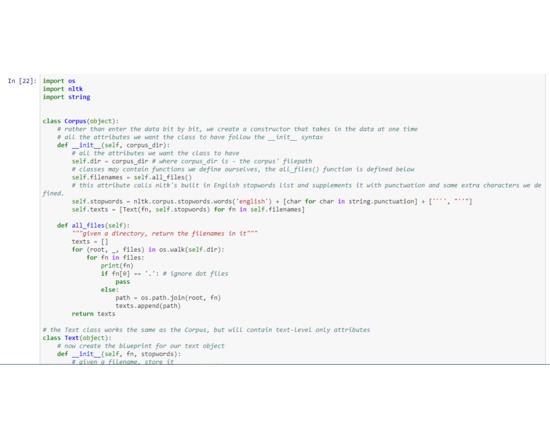
It is a set of code in Python that do the common things that humanists do to text as they prepare it for analysis. In starts with loading the text and proceeds to cleaning and dividing the text and preparing it for analysis. It also has a scraping tool to get data directly from websites. The user that has to do some basic modifications of text can just do some modifications of the code provided.

Rated 0.0 out of 5.

Analysis

HyperPo

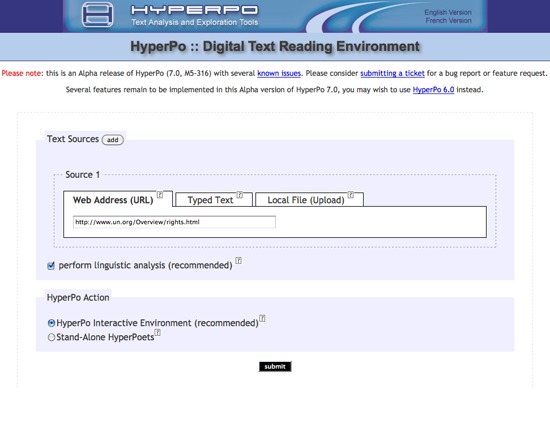
HyperPo is an important legacy tool, developed as the first web-based text analysis tool aimed at humanities scholars available from 1996 through 2006. Users could input a web address, upload a file or directly enter text for analysis. HyperPo's interface was available in both English and French. Though no longer available for use, a capture of HyperPo can be viewed through the Internet Archive's Wayback Machine.

Rated 0.0 out of 5.

Analysis

HyperRESEARCH

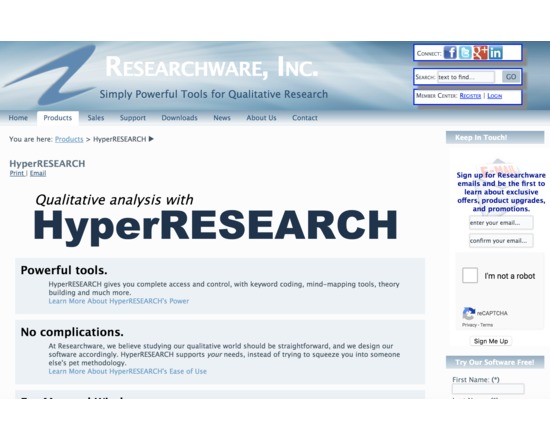
HyperRESEARCH enables users to code and retrieve, build theories, and conduct analyses of your data. You may work with text, graphics, audio and video sources.

Rated 0.0 out of 5.

Analysis

IBM: Many Eyes

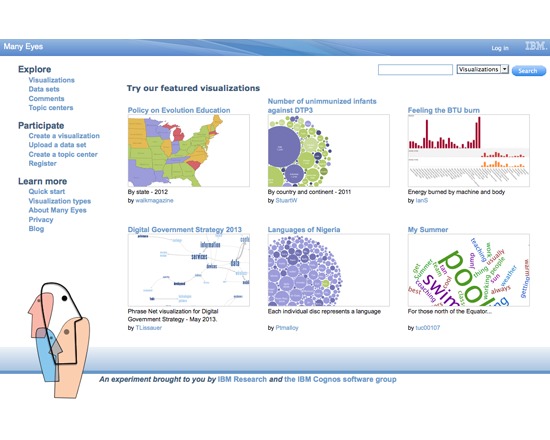
Many Eyes is a free collection of data visualization tools enabling exploration and discussion of the data. Users who post comments on a visualization may also save their view for others to see in conjunction with their comment. Visualizations can be created from the data sets loaded into the site, or one can upload a new dataset for use. Note : Uploaded datasets are shared with the site.

Rated 0.0 out of 5.

Analysis

iCharts

iCharts BI is the leading native visual reporting application for companies today. Build robust visuals and analytics without leaving your ERP dashboard. Provide a native NetSuite experience to all your users Manage your reporting and analytics Visualize your NetSuite data in real-time Learn more from your NetSuite data

Rated 0.0 out of 5.

›

Curated lists

Curated list created by experience authors in the fields.

All curated lists

Geoffrey Rockwell

Cool Voyant Tools

Not all Voyant tools show up in the default view or skin. Here is a list of some of the other tools worth trying.

4 tools

View list

Holly Pickering

Audio Production Software

Interested in audio production and editing? Here are a few programs that can help you get on your way. Some of them are free, some not, but all are helpful and useful.

3 tools

View list

Jason Bradshaw

TATR: Text Analysis for Twitter Research

This list compiles a suite of tools that make up Kynan Ly's Text Analysis for Twitter Research (TATR) Library. Recipes to these notebooks can be found on methodi.ca

6 tools

View list

The catalogue

  • 1321

    Tools catalogued

  • 15

    Curated lists

  • 22

    Analysis types

  • 671

    Community reviews

More is coming

Researchers, power users, and students will soon be able to contribute tools, share reviews, and curate lists around their own work.