
Visualization
eXist-db
eXist-db is an open source database management system that stores XML data according to the XML data model and features efficient, index-based XQuery processing.
For researchers who work with text
TAPoR catalogues concordancers, annotators, topic models, stylometry packages, and visualization environments. Every record notes the platform, the license, and what the tool is actually good for.
Filter by the type of analysis.
Visualization
eXist-db is an open source database management system that stores XML data according to the XML data model and features efficient, index-based XQuery processing.
Visualization
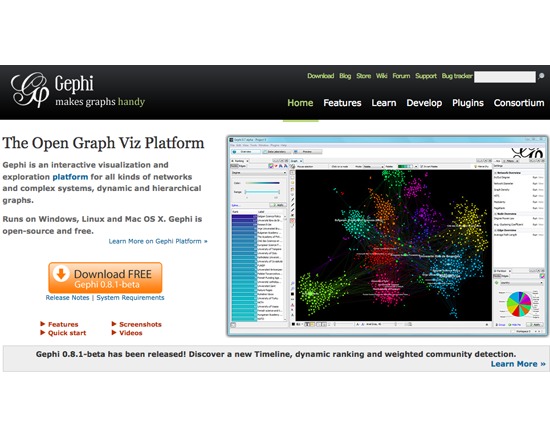
Gephi is a free, open source interactive visualization and data exploration tool. Users can manipulate the display to uncover new facets of the data, enabling intutive exploration.
Visualization
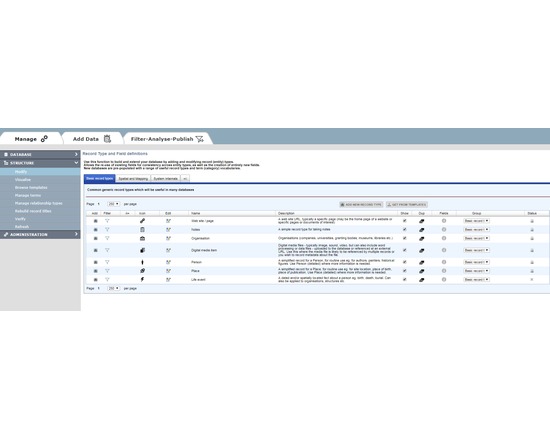
HEURIST (http://HeuristNetwork.org) is an extremely flexible, end-user oriented, web-based data management system designed specifically for Humanities data. Developed since 2005, it has been in active use across many projects since 2009. It is available both as a free web service for researchers (hosted at the University of Sydney Data Centre) or for installation on a physical or virtual server (Open Source on gitHub). Researchers can design, create, manage, analyse, visualise and publish their own richly-structured database(s) through a simple web interface, without the need for programmer(s). Quite complex databases can be built in a few hours by borrowing structures and vocabularies published by other users. Databases can be designed and built incrementally, as existing data are not affected by changes in structure. Databases created by Heurist are stored in MySQL with a repeatable structure facilitating sustainability and independent access by other software. Advanced features include record linking, graph structure, drill-down facet searches, rule-based queries, custom reports, linked map-timelines, network visualisation, normalised spreadsheet import, crosstabulation, XML feeds, XSLT transforms. The team provides initial email and skype assistance for project setup at no cost, and special customisations at modest cost. Heurist is applicable in many domains including History, Archaeology, Anthropology, Cultural Research, Linguistics, Media Studies etc. It handles everything from text, tags and categories, through networks of rich relationships and offset annotations, to images, video, spatial data and dating (including non-western systems and dating uncertainty). Sophisticated searches (including faceted and rule-based) can be saved, organised and rendered as layered interactive maps, timelines, network visualisations, crosstabulations, lists, custom reports, XML and XSLT transforms, all of which can easily be printed or embedded (live) in a website - Heurist provides the html code required to embed results in a web page or CMS. Databases can easily be migrated later to a personal or institutional server. Since the data are stored in a standard MySQL database with a fixed and well-documented structure, the data can be accessed directly via SQL from most programming languages independently of Heurist. Version 4.2 (Jan 2016 onwards) is available as a service via the Heurist website. Version 4 delivers a user-customisable interface of widgets, along with better mapping and visualisation. Existing version 3 databases are bidirectionally compatible with version 4.
Visualization
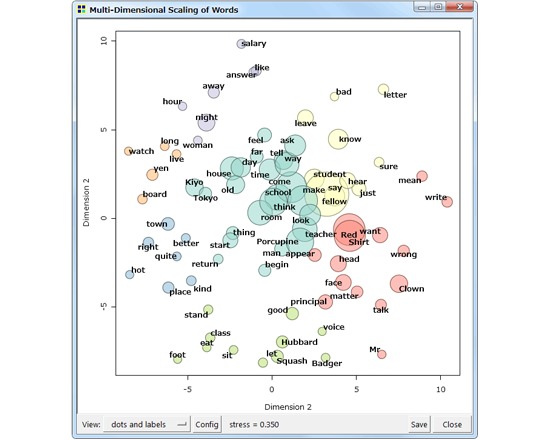
KH Coder is a tool for quantitative content analysis and text mining that has been under continuous development since 2001. It was originally developed for Japanese text and now supports numerous other languages, including English, Italian and French. KH Coder also has computational linguistics applications.
Visualization
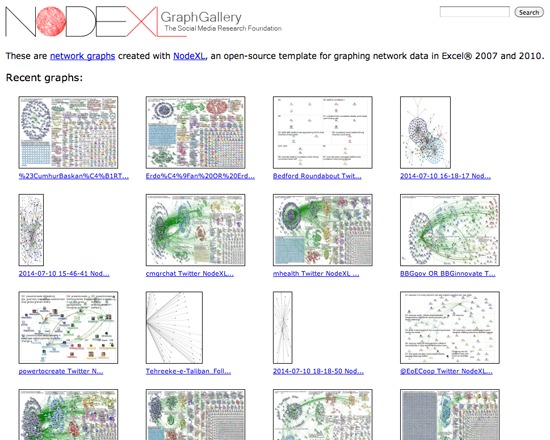
NodeXL is a free, open source tool for generating and exploring network graphs from Microsoft Excel files. It is particularly suited to data from social media sources, and includes the ability to directly import data from Twitter, YouTube, Flickr and email, with additional plugins available for gathering data from Facebook, Microsoft Exchange, wikis and URLs. The tool generates visualizations that can be adjusted, zoomed and filtered, with additional features for vertex grouping, graphing metric calculations, and automating tasks. NodeXL can both import and export data in GraphML, Pajek, UCINet and matrix formats.

Visualization
Omeka is a content management system designed for the display of library, museum, archives, and scholarly collections and exhibitions. Omeka falls at a crossroads of Web Content Management, Collections Management, and Archival Digital Collections Systems. Omeka is designed with non-IT specialists in mind, allowing users to focus on content and interpretation rather than programming. It brings Web 2.0 technologies and approaches to academic and cultural websites to foster user interaction and participation. It makes top-shelf design easy with a simple and flexible templating system. Its robust open-source developer and user communities underwrite Omeka’s stability and sustainability. Omeka allows users to publish cultural heritage objects, extend its functionality with themes and plugins, and curate online exhibits with digital objects.
Week of 1 Nov – 7 Nov
Three tools from the catalogue, each rated at least 3 stars. A new set appears each Sunday.
Curated list created by experience authors in the fields.

Geoffrey Rockwell
Not all Voyant tools show up in the default view or skin. Here is a list of some of the other tools worth trying.
4 tools
View list
Holly Pickering
Interested in audio production and editing? Here are a few programs that can help you get on your way. Some of them are free, some not, but all are helpful and useful.
3 tools
View list
Jason Bradshaw
This list compiles a suite of tools that make up Kynan Ly's Text Analysis for Twitter Research (TATR) Library. Recipes to these notebooks can be found on methodi.ca
6 tools
View list1321
Tools catalogued
15
Curated lists
22
Analysis types
671
Community reviews
Researchers, power users, and students will soon be able to contribute tools, share reviews, and curate lists around their own work.