Skip to content
TAPoR Text Analysis Portal for Research

For researchers who work with text

Find a text analysis tool that fits the work.

TAPoR catalogues concordancers, annotators, topic models, stylometry packages, and visualization environments. Every record notes the platform, the license, and what the tool is actually good for.

  • Platform, license, and method on every record
  • Reviews from people who teach with the tools
  • Lists assembled around a course or a corpus

Browse tools

Filter by the type of analysis.

View all tools
‹

Visualization

Chart.js

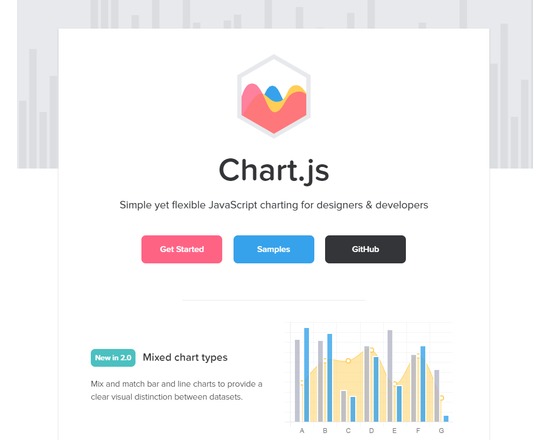
Simple yet flexible JavaScript charting for designers & developers. Open source: Chart.js is a community maintained project, contributions welcome! 8 Chart types: Visualize your data in 8 different ways; each of them animated and customisable. HTML5 Canvas: Great rendering performance across all modern browsers (IE9+). Responsive: Redraws charts on window resize for perfect scale granularity.
Rated 0.0 out of 5.

Visualization

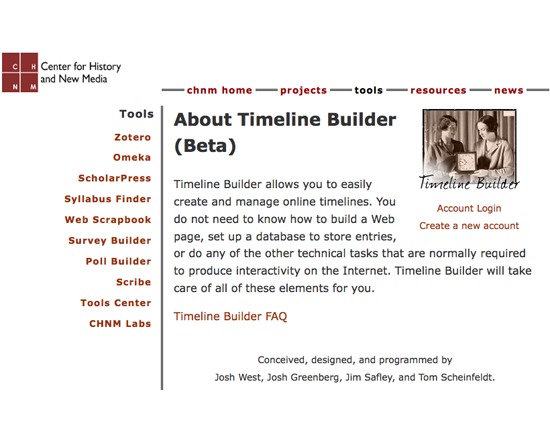
CHNM: Timeline Builder (Beta)

Timeline Builder is a free tool for creating and maintaining interactive, Flash-based timelines for viewing on the web. Basic text formatting and links to other resources can be added through basic HTML. This tool requires registration through the web page.

Rated 0.0 out of 5.

Visualization

Circos

Circos is a free visualization tool for creating publication-quality infographics and illustrations. Its visualizations are arranged in a circle to facilitate exploring relationships between objects and positions, which also has the benefit of offering a high data-to-ink ratio. Though promoted for the sciences, it is highly flexible and can visualize datasets from a wide variety of fields.

Rated 0.0 out of 5.

Visualization

Coggle

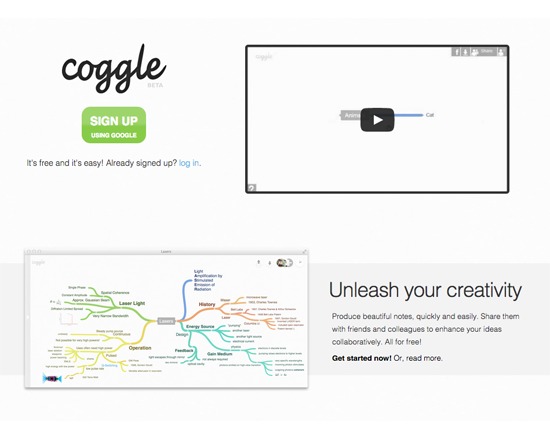
Coggle is a web-based tool for visualizing and applying non-linear structuring to information. Though Coggle has been used for mind mapping, it is primarily a method of documenting branching and non-linear information, and encompassing multiple perspectives. It utlizes a drag and drop interface for integrating images, permits multiple users to edit at the same time without causing data conflicts, and supports Markdown and LaTeX formatting. Coggle diagrams can be interlinked, branches of one diagram can be spawned off into its own diagram connected back to the original, and individual branches can be linked via hashtags. The tool includes an API that permits users to interface their diagrams with other programs and manupulate or examine them, and diagrams can also be exported in various formats such as plain-text outline, vector PDFs or images. Coggle is free except where users require more than 100 monthly active users or a closed source version.

Rated 0.0 out of 5.

Visualization

Communalytic

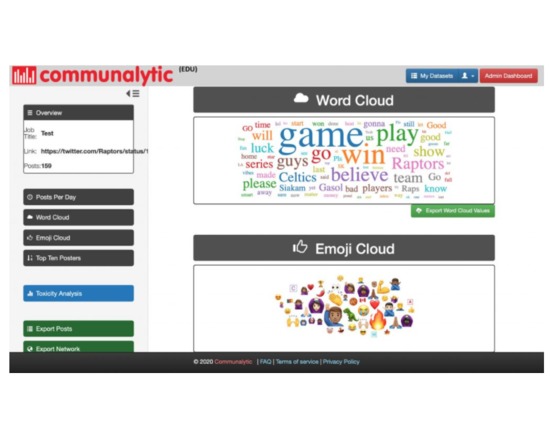
Communalytic is a research tool for studying online communities and online discourse. Communalytic can collect and analyze public data from social media platforms. It uses advanced text and social network analysis techniques to automatically pinpoint toxic and anti-social interactions, identify influencers, map shared interests and the spread of misinformation, and detect signs of possible coordination among seemingly disparate actors.

Rated 0.0 out of 5.

Visualization

Comparator - HTML (TAPoRware)

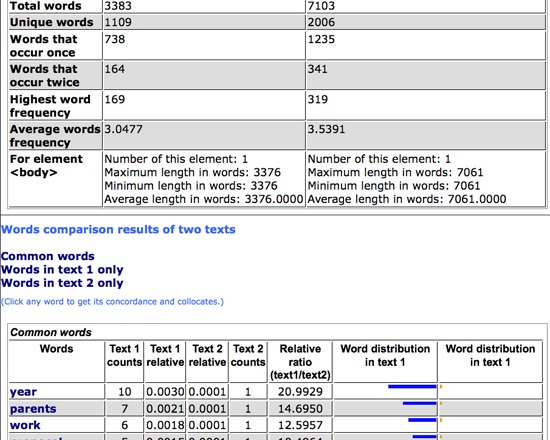
This tool compares two documents by comparing the words in each according to user specifications. XML and plain text versions are also available in the TAPoRware toolsets. This tool’s functionality has been incorporated into Voyant available online at www.voyant-tools.org

Rated 0.0 out of 5.

›

Curated lists

Curated list created by experience authors in the fields.

All curated lists

Geoffrey Rockwell

Cool Voyant Tools

Not all Voyant tools show up in the default view or skin. Here is a list of some of the other tools worth trying.

4 tools

View list

Holly Pickering

Audio Production Software

Interested in audio production and editing? Here are a few programs that can help you get on your way. Some of them are free, some not, but all are helpful and useful.

3 tools

View list

Jason Bradshaw

TATR: Text Analysis for Twitter Research

This list compiles a suite of tools that make up Kynan Ly's Text Analysis for Twitter Research (TATR) Library. Recipes to these notebooks can be found on methodi.ca

6 tools

View list

The catalogue

  • 1321

    Tools catalogued

  • 15

    Curated lists

  • 22

    Analysis types

  • 671

    Community reviews

More is coming

Researchers, power users, and students will soon be able to contribute tools, share reviews, and curate lists around their own work.