Skip to content
TAPoR Text Analysis Portal for Research

For researchers who work with text

Find a text analysis tool that fits the work.

TAPoR catalogues concordancers, annotators, topic models, stylometry packages, and visualization environments. Every record notes the platform, the license, and what the tool is actually good for.

  • Platform, license, and method on every record
  • Reviews from people who teach with the tools
  • Lists assembled around a course or a corpus

Browse tools

Filter by the type of analysis.

View all tools
‹

Visualization

Crowdmap

Crowdmap allows the investigator to set up a Web map around a particular topic and invite multiple users (participants, research subjects, collaborators, multiple assistants) to contribute information to the map on their own time and from their own device. For $10/month, users can buy fee-based services including private maps and custom branding. Users have complained that Crowdmap is glitchy and unreliable. It is hard to find recent examples of successful projects built with the app. There is no other free and open source tool that fills the precise niche. For a freemium closed source service that allows crowdsourced point data only, try ZeeMaps. For a fee-based, open source crowd mapping tool, try the shared tables function of CartoDB.
Rated 0.0 out of 5.

Visualization

CulturalAnalytics

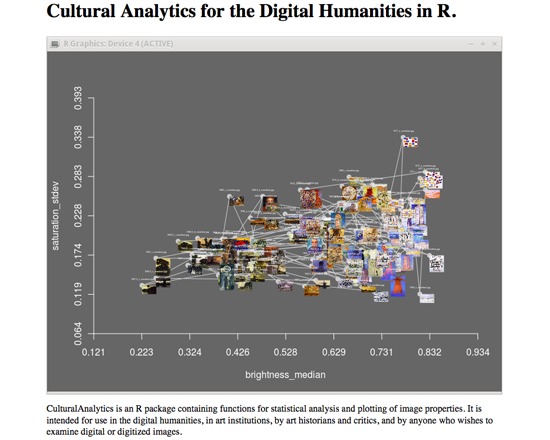
CulturalAnalytics, also known as Cultural Analytics for the Digital Humanities in R, is a free R package of functions for statistical analysis and plotting image properties, developed by Rob Myers specifically for the Digital Humanities, and of value to anyone else with an interest in examining digital or digitized images. It includes statistical functions and can generate histograms, colour clouds, image scatter charts and more.

Rated 0.0 out of 5.

Visualization

Cytoscape

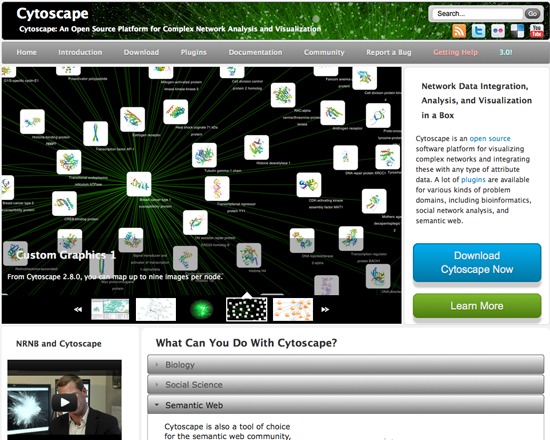
Cytoscape is an open source software platform for visualizing data networks and pathways. Though designed for bioinformatic systems, it has been generalized to complex network analysis and has applications extending to the semantic web. Its core distribution has basic features for data integration and visualization, with additional features available via Java-based plugins.

Rated 0.0 out of 5.

Visualization

D3.js

D3.js is a data visualization library by Mike Bostock, who is also the primary creator of Protovis, which D3 is designed to replace. There is a great introductory tutorial available from Luke Franci. It is one of many other tutorials linked to from Bostock's D3 wiki.

Rated 0.0 out of 5.

Visualization

d3.js - Data Driven Documents

D3.js is a free, open source JavaScript library for manipulating documents with data utilizing HTML5, SVG and CSS3. It is designed to create visualizations that work with current web standards to make the best possible use of the most recent browsers without requiring a proprietary framework. This tool allows users to bind data to an Document Object Model (DOM) and apply data-driven transformations to the document.

Rated 0.0 out of 5.

Visualization

Data Desk

Data Desk implements traditional statistical techniques using a simple graphic display interface for data exploration. The program focuses specifically on the visual exploration of data.

Rated 0.0 out of 5.

›

Curated lists

Curated list created by experience authors in the fields.

All curated lists

Geoffrey Rockwell

Cool Voyant Tools

Not all Voyant tools show up in the default view or skin. Here is a list of some of the other tools worth trying.

4 tools

View list

Holly Pickering

Audio Production Software

Interested in audio production and editing? Here are a few programs that can help you get on your way. Some of them are free, some not, but all are helpful and useful.

3 tools

View list

Jason Bradshaw

TATR: Text Analysis for Twitter Research

This list compiles a suite of tools that make up Kynan Ly's Text Analysis for Twitter Research (TATR) Library. Recipes to these notebooks can be found on methodi.ca

6 tools

View list

The catalogue

  • 1321

    Tools catalogued

  • 15

    Curated lists

  • 22

    Analysis types

  • 671

    Community reviews

More is coming

Researchers, power users, and students will soon be able to contribute tools, share reviews, and curate lists around their own work.