Skip to content
TAPoR Text Analysis Portal for Research

For researchers who work with text

Find a text analysis tool that fits the work.

TAPoR catalogues concordancers, annotators, topic models, stylometry packages, and visualization environments. Every record notes the platform, the license, and what the tool is actually good for.

  • Platform, license, and method on every record
  • Reviews from people who teach with the tools
  • Lists assembled around a course or a corpus

Browse tools

Filter by the type of analysis.

View all tools
‹

Visualization

DeeperWeb

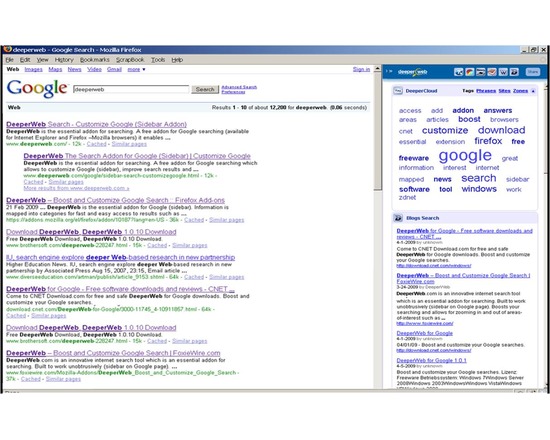
DeeperWeb was a browser add-on that adds a tag cloud to Google search results. It grouped and sorted the results obtained from google search for further exploration. It provides tags related to the search item and helps the user refine the search. As of 2016, it is no longer available.

Rated 0.0 out of 5.

Visualization

DfR Browser

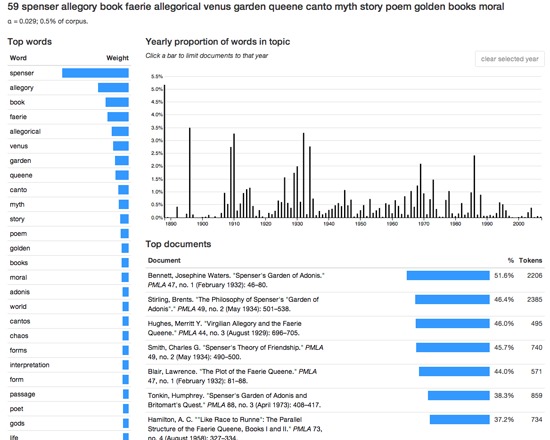
The DfR Browser is a free, open source visualization interface for exploring aggragates of articles from the JSTOR database. It uses topic modelling, co-occurrances and document metadata to provide multiple views on the corpus of interest based on topic searches, via several specialized views such as scaled, list and yearly subviews. Users can test the DfR browser via the provided web demo, which incudes a broad selection of pre-loaded topics, or download the source code to use the tool with their own data. The tool's output can be imported into Mallet for further analysis.

Rated 0.0 out of 5.

Visualization

DH Press

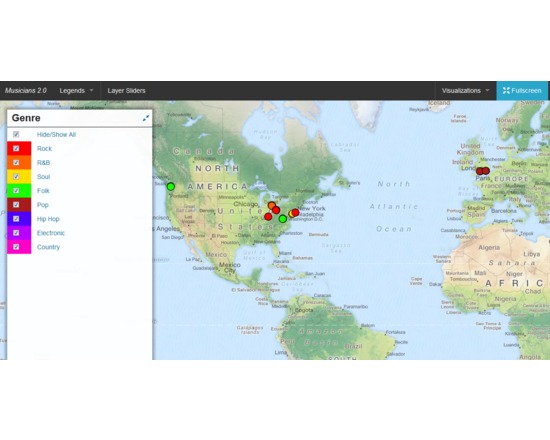
DH Press (originally called diPH) is a toolkit conceived as an easy-to-use WordPress plugin which allows potentially every kind of user to visualise and mashup historic and geographic information, documents and various types of multimedia content to develop digital humanities project. The user cannot start from the toolkit itself, as the first step to set up a project, when the toolkit is already installed, is a CSV import. This means that the raw information has to be processed first, through any software like Microsoft Excel or Google Spreadsheet, following some conventions dictated by the toolkit, and once completed must be exported in CSV format. The file can then be imported into DH Press. At this point, the user finally has full control over the data. First, the toolkit needs to be informed of what kind of data is in each column, as it can handle various types, such as Short Text, Long Text, Lat/Lon, Date, and Link. The steepest learning curve resides here, in the data management part, as the database must be set up very carefully, and fixing any problem later is complex. This does not mean that new users cannot approach the tool, but some basic research on data management is required to make correct use of it. After setting up all this fields, called “motes” in the toolkit, a legend can be assigned to each of them, for example a field called “city” might contain, through multiple entries, ten different cities, and to each of those will correspond the colour chosen by the user. It is also possible to assign icons or png images instead of colours. A single control panel then allows the user to create, set up and manage multiple visualisations of different kind, and in each of them the user can choose which information to display and how. This part is the most useful and is really straightforward. The last section of the control panel lets the user set up custom fields for data and run a test of the whole project, and outputs detailed error information. Following the training page, http://dhpress.org/training/, it is possible to take advantage of a pre-existing database, which can be used to quickly set up a project, so that one can instantly work on the main control panel. There is a detailed google document that guides the user through the process step by step, and also offers an even more detailed annex. A couple of hours is enough to go through all of it and get the necessary information to use it correctly. Then, any view can be quickly set up and customised in any desired way. Overall, this toolkit is quite stable, reliable, user-friendly after the first entry barrier and gives you a varied set of tools to visualise and display a large amount of data in a neat, organised manner. For a more detailed and personal review, please read http://claudiasartori.com/2015/01/tool-review-dh-press/

Rated 0.0 out of 5.

Visualization

Discursis

Discursis is a tool for analyzing text-based natural language with a focus on sequential analysis. It is particularly desgined to work with texts that have an internal temporal structure, such as a transcribed conversation. For each text, it generates a statistics-based internal language model and applies tagging to each temporal unit detected. The model and tagging are then used as the basis for an interactive visualization which permits examination at a various levels of granularity, ranging from a whole-text to a unit-by-unit level; it can also show topic usage patterns within the text. Users must purchase a license; both student and academic trial licenses are available.

Rated 0.0 out of 5.

Visualization

Distribution Graph - HTML (TAPoRware)

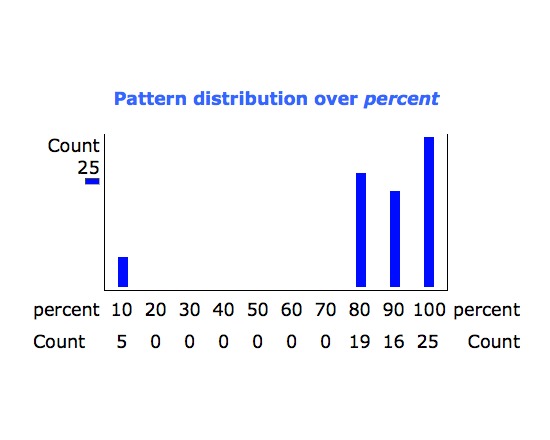
This tool creates a graphical distribution list of words found within specific HTML elements. XML and plain text versions are also available within the TAPoRware toolsets. This tool’s functionality has been incorporated into Voyant available online at www.voyant-tools.org

Rated 0.0 out of 5.

Visualization

Distribution Graph - Plain Text (TAPoRware)

This tool creates a graphical distribution list of words found within the text document. HTML and XML versions are also available within the TAPoRware toolsets. This tool’s functionality has been incorporated into Voyant available online at www.voyant-tools.org

Rated 0.0 out of 5.

›

Curated lists

Curated list created by experience authors in the fields.

All curated lists

Geoffrey Rockwell

Cool Voyant Tools

Not all Voyant tools show up in the default view or skin. Here is a list of some of the other tools worth trying.

4 tools

View list

Holly Pickering

Audio Production Software

Interested in audio production and editing? Here are a few programs that can help you get on your way. Some of them are free, some not, but all are helpful and useful.

3 tools

View list

Jason Bradshaw

TATR: Text Analysis for Twitter Research

This list compiles a suite of tools that make up Kynan Ly's Text Analysis for Twitter Research (TATR) Library. Recipes to these notebooks can be found on methodi.ca

6 tools

View list

The catalogue

  • 1321

    Tools catalogued

  • 15

    Curated lists

  • 22

    Analysis types

  • 671

    Community reviews

More is coming

Researchers, power users, and students will soon be able to contribute tools, share reviews, and curate lists around their own work.