Skip to content
TAPoR Text Analysis Portal for Research

For researchers who work with text

Find a text analysis tool that fits the work.

TAPoR catalogues concordancers, annotators, topic models, stylometry packages, and visualization environments. Every record notes the platform, the license, and what the tool is actually good for.

  • Platform, license, and method on every record
  • Reviews from people who teach with the tools
  • Lists assembled around a course or a corpus

Browse tools

Filter by the type of analysis.

View all tools
‹

Visualization

EURAC: Structured Parallel Coordinates

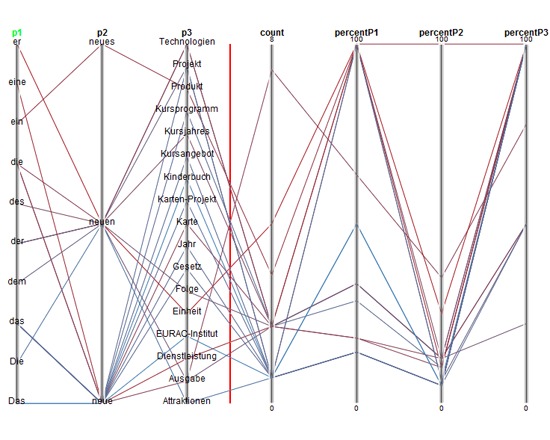
Structured Parallel Coordinates is a free JavaScript data visualization tool offered by EURAC. It is intended for data that contains some kind of structure, such as temporal ordering, strings or ranked orderings. EURAC has provided several examples, such as ngram comparisons, (sub)corpus comparison and KWIC with live corpus queries.
Rated 0.0 out of 5.

Visualization

Exploratree

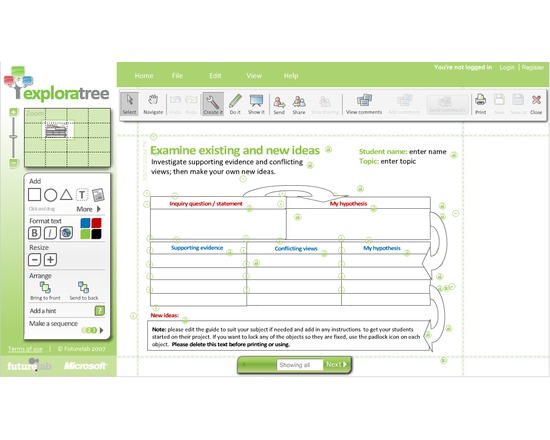
Exploratree is a web-based library and editing application for "interactive thinking guides," which are templates useful for mind mapping, brainstorming, planning, and visualization. Originally developed for use in the classroom, to help students refine and focus their ideas, as well as manage plans to further their investigation. Thinking guides can be edited, printed, and downloaded directly from the browser.

Rated 0.0 out of 5.

Visualization

Finding Popular Hashtags

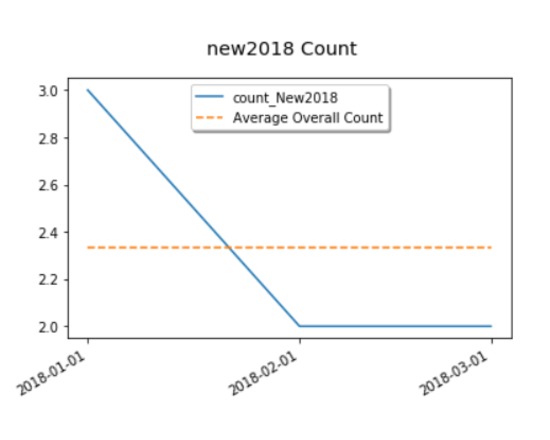
TATR: This notebook is part of a greater series of Juypter Notebook structured around Twitter Tweet analysis. This particular notebook will look at finding the most popular hashtag for a given date. This notebook will showcase two main features with the end goal of finding the most popular hashtag by date. The first feature is collapsing all the tokenized hashtag of a date into a larger set. The second feature is to save the "tokenized list" into a csv and load it back such that Panda dataframes can still treat this as a list. This notebook will also provide the a framework that can be expanded to suit your needs.

Rated 0.0 out of 5.

Visualization

Flare

Flare is an ActionScript library for creating visualizations that run in the Adobe Flash Player. From basic charts and graphs to complex interactive graphics, the toolkit supports data management, visual encoding, animation, and interaction techniques. Flare features a modular design that lets developers create customized visualization techniques without having to reinvent the wheel.

Rated 0.0 out of 5.

Visualization

Flot

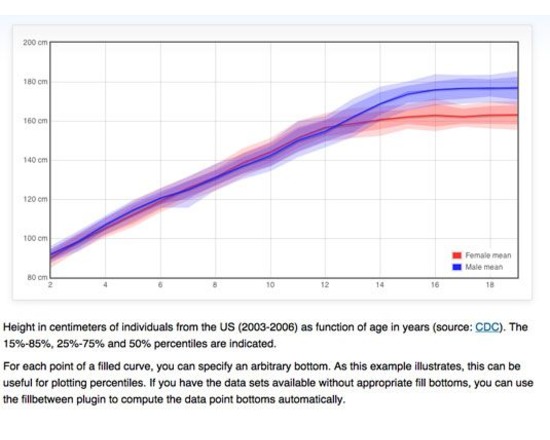
Flot is a pure JavaScript plotting library for jQuery, with a focus on simple usage, attractive looks and interactive features.

Rated 0.0 out of 5.

Visualization

Flourish

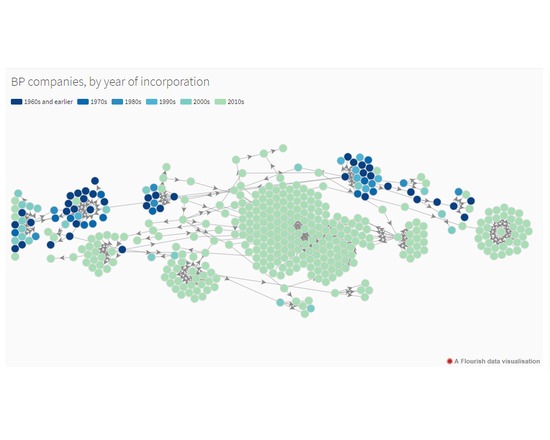
Explore and explain your data with stunning visualizations and stories. Publish, present or download. No need to code or install software.

Rated 0.0 out of 5.

›

Curated lists

Curated list created by experience authors in the fields.

All curated lists

Geoffrey Rockwell

Cool Voyant Tools

Not all Voyant tools show up in the default view or skin. Here is a list of some of the other tools worth trying.

4 tools

View list

Holly Pickering

Audio Production Software

Interested in audio production and editing? Here are a few programs that can help you get on your way. Some of them are free, some not, but all are helpful and useful.

3 tools

View list

Jason Bradshaw

TATR: Text Analysis for Twitter Research

This list compiles a suite of tools that make up Kynan Ly's Text Analysis for Twitter Research (TATR) Library. Recipes to these notebooks can be found on methodi.ca

6 tools

View list

The catalogue

  • 1321

    Tools catalogued

  • 15

    Curated lists

  • 22

    Analysis types

  • 671

    Community reviews

More is coming

Researchers, power users, and students will soon be able to contribute tools, share reviews, and curate lists around their own work.