Skip to content
TAPoR Text Analysis Portal for Research

For researchers who work with text

Find a text analysis tool that fits the work.

TAPoR catalogues concordancers, annotators, topic models, stylometry packages, and visualization environments. Every record notes the platform, the license, and what the tool is actually good for.

  • Platform, license, and method on every record
  • Reviews from people who teach with the tools
  • Lists assembled around a course or a corpus

Browse tools

Filter by the type of analysis.

View all tools
‹

Visualization

GeoTime

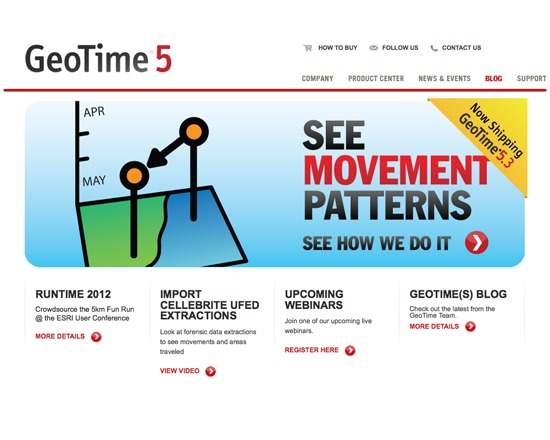
GeoTime is a tool for visualizing complex event-related data available for purchase. It can simultaneously visualize geospatial, temporal and link data to display activities and events. Data can be imported from ArcGIS or Microsoft Excel.

Rated 0.0 out of 5.

Visualization

Gerbil

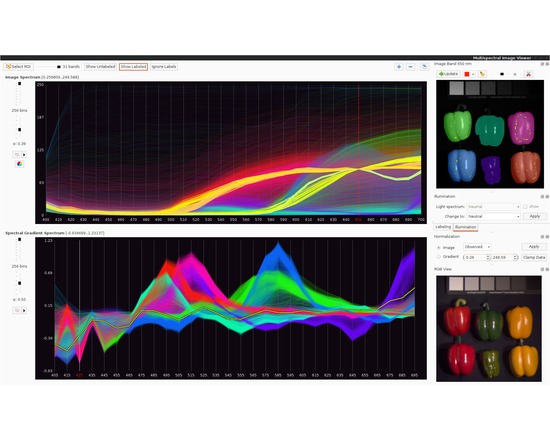
Gerbil is a generic framework for visualization and analysis of multispectral and hyperspectral data that strives to both bring new innovations in analysis capabilities and be of use in a wide range of hyperspectral data applications. In a nutshell, Gerbil lets you… explore a multispectral or hyperspectral image before processing it, apply common computer vision algorithms adapted to hyperspectral data, cluster and label image pixels for your application scenario, assess your own algorithms via high-dimensional data visualization, use an intuitive interface for teaching multispectral imaging and reflectance analysis. One example application for Gerbil is finding hidden information in multispectral scans of old manuscripts or art pieces.

Rated 0.0 out of 5.

Visualization

gFacet

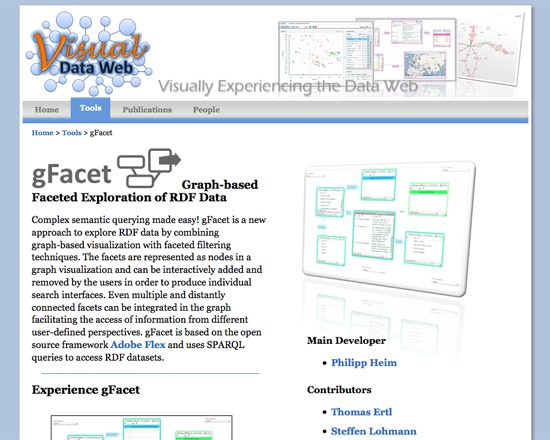
gFacet is a tool for graph-based visualization of RDF data developed as part of the Visual Data Web toolset and based on the Adobe Flex open source framework. Using SPARQL to access the user's dataset, it integrates filtering based on facets represented as nodes within the visualization to enable users to select which they wish to work with and create custom search interfaces.

Rated 0.0 out of 5.

Visualization

Gliffy

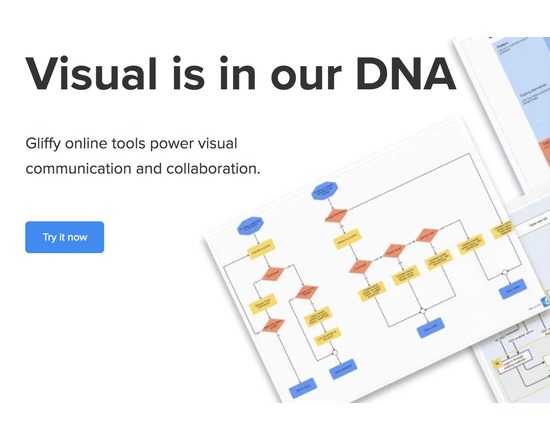
Gliffy is a tool that makes it easy to create, share, and collaborate on a wide range of diagrams. Gliffy works directly in your browser and can be used to build flow charts, organization charts, network diagrams, workflows, technical drawings, and wireframes.

Rated 0.0 out of 5.

Visualization

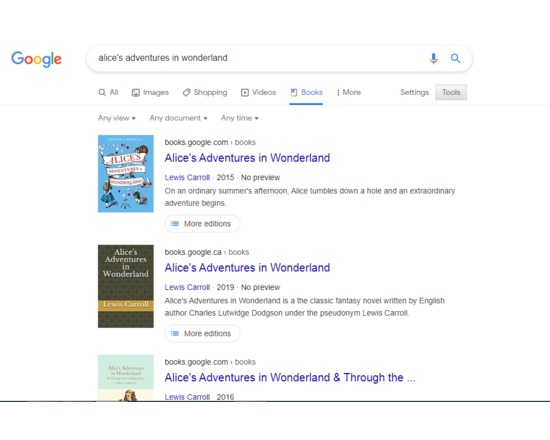
Google Books

Google Books provides full, free PDF scans (and web-viewable versions) of public domain books and magazines, free previews of some books and magazines under copyright, and the option to purchase digital editions of available items to save and read on Google Play, their e-reading platform. You can also find a local library based on your zip code that has the item available. Reader reviews of the items are available and you can contribute your own. Search for authors, titles, as well as keywords and Google will return results with matches in the title/text of the item. There are permalinks to available pages. Highly useful for finding items that contain your keywords in its text. It has the Google Ngram Viewer as part of its service. The Ngram Viewer is a service connected to Google Books that graphs the frequency of word usage across their book collection

Rated 0.0 out of 5.

Visualization

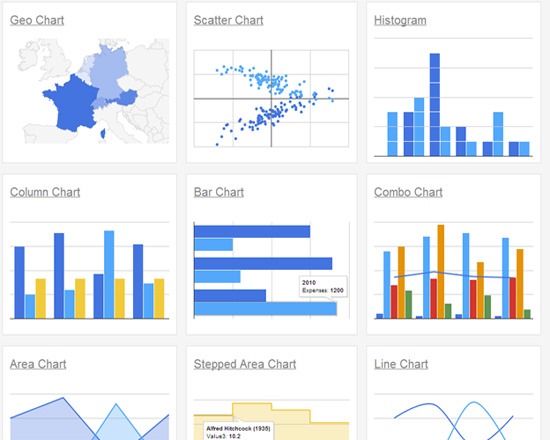
Google Charts

Google Charts (formerly the Google Visualization API) is a web-based interface for interactive data visualization via HTML5 and SVG. It includes a number of preset chart types ranging from line charts to word trees and all are customizable. A separate selection of user community contributed chart types is also available. Within a chart, the API identifies events that users can trigger with presets ranging from simple clicks to Javascript methods, and enable users to construct chart dashboards that can be embedded in their website along with the chart proper.

Rated 0.0 out of 5.

›

Curated lists

Curated list created by experience authors in the fields.

All curated lists

Geoffrey Rockwell

Cool Voyant Tools

Not all Voyant tools show up in the default view or skin. Here is a list of some of the other tools worth trying.

4 tools

View list

Holly Pickering

Audio Production Software

Interested in audio production and editing? Here are a few programs that can help you get on your way. Some of them are free, some not, but all are helpful and useful.

3 tools

View list

Jason Bradshaw

TATR: Text Analysis for Twitter Research

This list compiles a suite of tools that make up Kynan Ly's Text Analysis for Twitter Research (TATR) Library. Recipes to these notebooks can be found on methodi.ca

6 tools

View list

The catalogue

  • 1321

    Tools catalogued

  • 15

    Curated lists

  • 22

    Analysis types

  • 671

    Community reviews

More is coming

Researchers, power users, and students will soon be able to contribute tools, share reviews, and curate lists around their own work.