Skip to content
TAPoR Text Analysis Portal for Research

For researchers who work with text

Find a text analysis tool that fits the work.

TAPoR catalogues concordancers, annotators, topic models, stylometry packages, and visualization environments. Every record notes the platform, the license, and what the tool is actually good for.

  • Platform, license, and method on every record
  • Reviews from people who teach with the tools
  • Lists assembled around a course or a corpus

Browse tools

Filter by the type of analysis.

View all tools
‹

Visualization

IsaViz

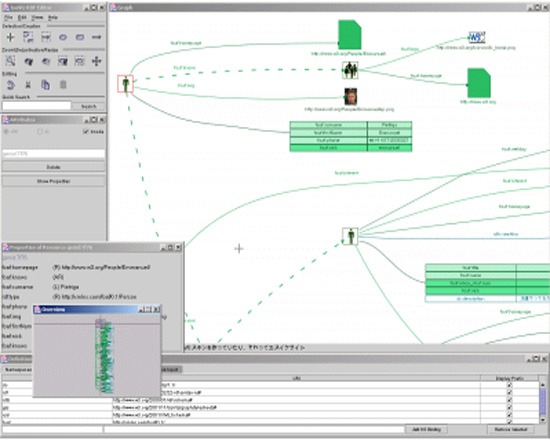
IsaViz is a visual authoring and data browsing tool for RDF models represented as graphs, developed by the W3C. permits uses to both create and edit graphs, and can render graphs from GSS stylesheets as a node-link diagram. It is freely available for download. This tool is no longer in active development.
Rated 0.0 out of 5.

Visualization

Issuecrawler

Issuecrawler is a free, web-based tool for performing co-link analysis on URLs, and generating a cluster graph of the results. Its options include snowball crawling for up to three degrees of separation, and inter-actor crawling. Users must request a free account before using the tool.

Rated 0.0 out of 5.

Visualization

JavaScript InfoVis Toolkit

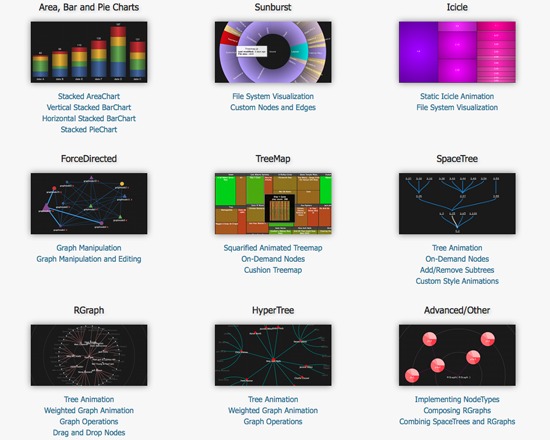
The JavaScript InfoVis Toolkit is a free set of tools for creating interactive data visualizations compatible with web standards. Visualization options include bar graphs, radial graphs, tree graphs and more, many integrating animations.

Rated 0.0 out of 5.

Visualization

Jigsaw

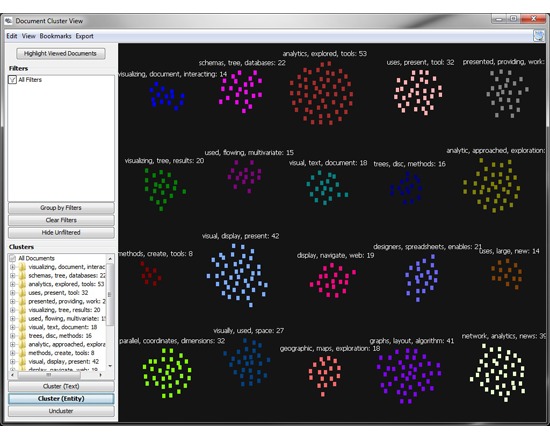
Jigsaw is a free visual analytics application for exploring collections of documents such as text or spreadsheets. It is aimed at analysists and researchers, particularly to "help analysts reach more timely and accurate understandings of the larger stories and important concepts embedded throughout textual results" via a collection of visualizations representing aspects such as important entities and their interconnections. The visualizations include graph, temporal and connections-based, and can be viewed on a document or corpus level.

Rated 0.0 out of 5.

Visualization

JpGraph

JpGraph is an Object-Oriented Graph creating library for PHP5 (>=5.1) and PHP7.0. The library is completely written in PHP and ready to be used in any PHP scripts (both CGI/APXS/CLI versions of PHP are supported).

Rated 0.0 out of 5.

Visualization

jqplot

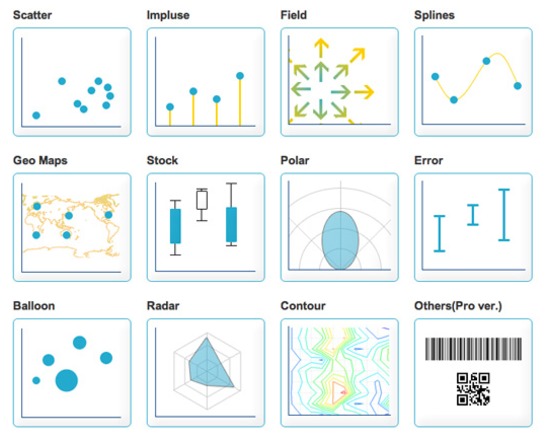
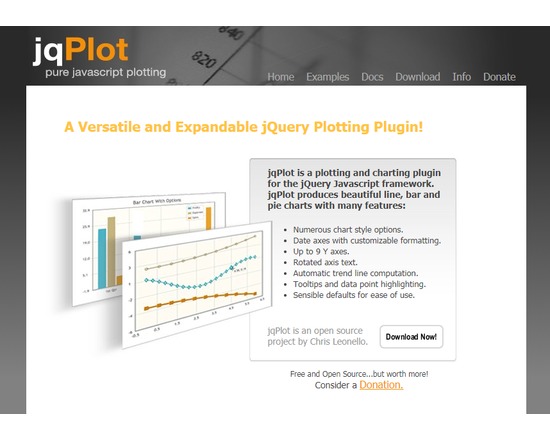
jqPlot is a plotting and charting plugin for the jQuery Javascript framework. jqPlot produces beautiful line, bar and pie charts with many features: Numerous chart style options. Date axes with customizable formatting. Up to 9 Y axes. Rotated axis text. Automatic trend line computation. Tooltips and data point highlighting. Sensible defaults for ease of use.

Rated 0.0 out of 5.

›

Curated lists

Curated list created by experience authors in the fields.

All curated lists

Geoffrey Rockwell

Cool Voyant Tools

Not all Voyant tools show up in the default view or skin. Here is a list of some of the other tools worth trying.

4 tools

View list

Holly Pickering

Audio Production Software

Interested in audio production and editing? Here are a few programs that can help you get on your way. Some of them are free, some not, but all are helpful and useful.

3 tools

View list

Jason Bradshaw

TATR: Text Analysis for Twitter Research

This list compiles a suite of tools that make up Kynan Ly's Text Analysis for Twitter Research (TATR) Library. Recipes to these notebooks can be found on methodi.ca

6 tools

View list

The catalogue

  • 1321

    Tools catalogued

  • 15

    Curated lists

  • 22

    Analysis types

  • 671

    Community reviews

More is coming

Researchers, power users, and students will soon be able to contribute tools, share reviews, and curate lists around their own work.