Skip to content
TAPoR Text Analysis Portal for Research

For researchers who work with text

Find a text analysis tool that fits the work.

TAPoR catalogues concordancers, annotators, topic models, stylometry packages, and visualization environments. Every record notes the platform, the license, and what the tool is actually good for.

  • Platform, license, and method on every record
  • Reviews from people who teach with the tools
  • Lists assembled around a course or a corpus

Browse tools

Filter by the type of analysis.

View all tools
‹

Visualization

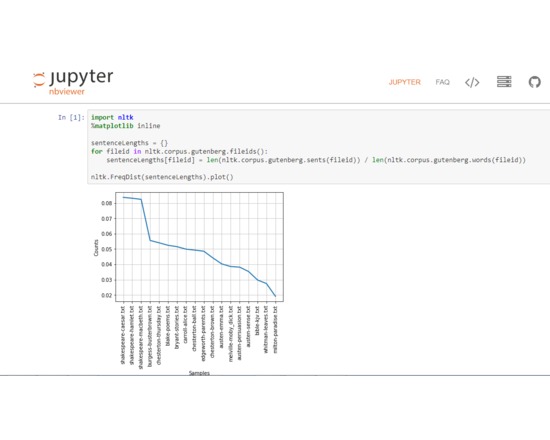
Jupyter notebook: Document similarity

A Jupyter notebook that show some methods of comparing documents. The methods included are: -Document term matrix -TF-IDF -Cosine similarity -Visualizing document similarity with scatterplots -Visualizing document similarity with dendrograms

Rated 0.0 out of 5.

Visualization

Juxta

Juxta is a free, open source tool for comparing and collating texts, originally intended for comparing multiple versions of the same text. It offers several views and visualization options, including histograms and side by side comparison. Juxta is available as both a desktop application and as a web service that can be integrated into the user's own website.

Rated 0.0 out of 5.

Visualization

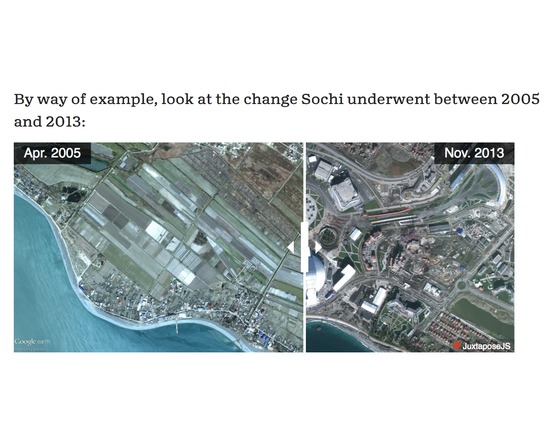
JuxtaposeJS

JuxtaposeJS helps tell stories by comparing two image frames, including photos and gifs. It provides a means, by a draggable pane, to see the changes and visually analyse the differences between the two images. It’s an adaptable storytelling tool that is ideal for highlighting then/now stories that explain slow changes over time (growth of a city skyline, regrowth of a forest, etc.) or before/after stories that show the impact of single dramatic events (natural disasters, protests, wars, etc.). JuxtaposeJS is free, easy to use, and open source. Almost anyone can use JuxtaposeJS, so long as you’ve got links to two similar pieces of media (hosted on your own server or on Flickr). Once you’ve got the links, all you need to do is copy and paste the URLs into the appropriate fields at Juxtapose.knightlab.com, modify labels as you see fit, add photo credits, and then copy and paste the resulting embed code into your site. You’ve probably seen similar photo slider tools elsewhere. They work well, but we built JuxtaposeJS without relying on jQuery, which makes the tool more lightweight, flexible, and adaptable. It’s also accessible to any newsroom or journalist, regardless of technical skills. It also offers some customization out of the box. You can modify the handle’s start position to highlight the area of change and choose to click the slider instead of dragging. It is responsive and works on phones and tablets with the touch or swipe of a finger.

Rated 0.0 out of 5.

Visualization

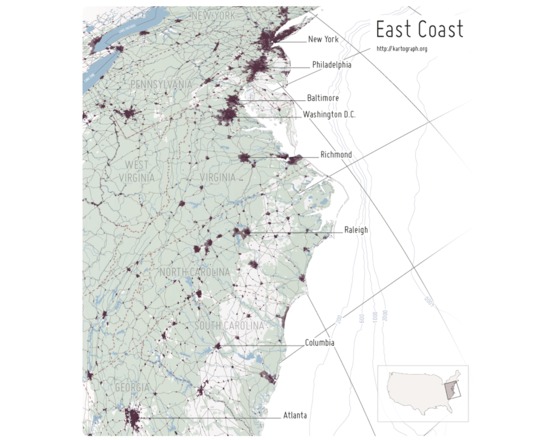
Kartograph

Kartograph is a pair of free and open source libraries for representing data with a spatial component on webpages or in print. The first library, Kartograph.py, is a Python library that builds lightweight vector graphic maps from either shapefiles or PostGIS tables. These graphics files can be styled either using a cascading style sheet during creation or later on the second library, Kartograph.js. The vector files can also be edited and enhanced in a vector graphics program like Adobe Illustrator. Kartograph.js allows the user to create interactive maps for web pages and web applications, using vector graphics files and data files to both draw the basemap and the features of interest. Unlike many web-based mapping libraries, Kartograph.js requires no server or even internet connection. All of the pertinent information is in the vector and data files. The results are highly customizable and can absolutely arresting, visually.

Rated 0.0 out of 5.

Visualization

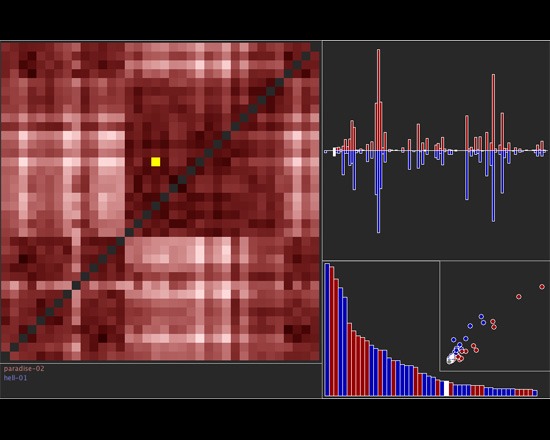
LATtice

LATtice is a free visualization tool for exploring and comparing texts across corpora. It also has features for 'drilling down' to determine what rhetorical categories make texts similar or different, and shows multiple visualizations in the same view. Documentation is available with download, and LATtice is available in Windows, OS X and Linux versions.

Rated 0.0 out of 5.

Visualization

Leaflet

This JavaScript library can be used to create mobile-friendly interactive maps. It does not provide data to map, but can be used to map spatial data in GeoJSON format, or display tiles from other sources such as MapBox.

Rated 0.0 out of 5.

›

Curated lists

Curated list created by experience authors in the fields.

All curated lists

Geoffrey Rockwell

Cool Voyant Tools

Not all Voyant tools show up in the default view or skin. Here is a list of some of the other tools worth trying.

4 tools

View list

Holly Pickering

Audio Production Software

Interested in audio production and editing? Here are a few programs that can help you get on your way. Some of them are free, some not, but all are helpful and useful.

3 tools

View list

Jason Bradshaw

TATR: Text Analysis for Twitter Research

This list compiles a suite of tools that make up Kynan Ly's Text Analysis for Twitter Research (TATR) Library. Recipes to these notebooks can be found on methodi.ca

6 tools

View list

The catalogue

  • 1321

    Tools catalogued

  • 15

    Curated lists

  • 22

    Analysis types

  • 671

    Community reviews

More is coming

Researchers, power users, and students will soon be able to contribute tools, share reviews, and curate lists around their own work.