
Visualization
nodegoat
nodegoat creates visualizations and provides a graphical user interface for the maintenance of data. It combines a variety of data management functions into one program.
For researchers who work with text
TAPoR catalogues concordancers, annotators, topic models, stylometry packages, and visualization environments. Every record notes the platform, the license, and what the tool is actually good for.
Filter by the type of analysis.
Visualization
nodegoat creates visualizations and provides a graphical user interface for the maintenance of data. It combines a variety of data management functions into one program.

Visualization
NVivo is a commercial software package for creating workspaces and corpuses. Its features include importing YouTube videos and comments, social media posts and discussions, web page and PDF capture, multiple language support and support for a wide variety of data formats such as spreadsheets, images, database tables and so on. Users can query their data in a variety of ways, annotate, cross-link and visualize connections, ideas and findings with charts, maps and models

Visualization
OmniGraffle is a comprehensive diagramming and drawing application. Drag and drop to create wireframes, flow charts, network diagrams, UI mockups, family trees, office layouts, etc.. Upgrading to OmniGraffle Pro adds Visio support, shared layers, presentation mode, object-geometry controls, AppleScript and Actions support and more.
Visualization
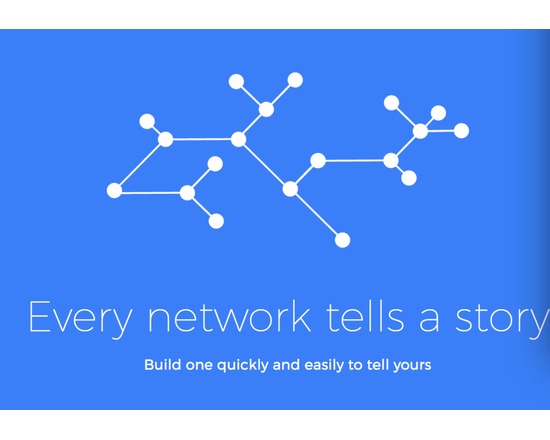
Onodo is a user friendly tool for doing basic visualisation and analysis within a browser making it cross-platform right out of the box. Data can be entered via their intuitive, in-browser node and edge creation tables or imported from a file. As data is added it is instantly previewed and displayed. The visual appearance can be tweaked on the fly and customised in a variety of ways (including applying a unique image or URL to each node). Once created, visualisations can be embedded and shared outside of the Onodo browser environment. Moreover, with a click of a button, Onodo calculates standard network parameters such as betweenness, closeness and displays these values within the table. It calculates and demonstrates basic network parameters and measures quickly and allows for the creation of chapters that cement using the visualisation as a data-driven narrative device.

Visualization
OpenLayers is a Javascript library that can display map tiles and markers loaded from any source in web browser. It provides an API for building rich web-based geographic applications. OpenLayers makes it easy to put a dynamic map in any web page. It can display map tiles, vector data and markers loaded from any source. OpenLayers has been developed to further the use of geographic information of all kinds. It is completely free, Open Source JavaScript, released under the 2-clause BSD License (also known as the FreeBSD).
Visualization
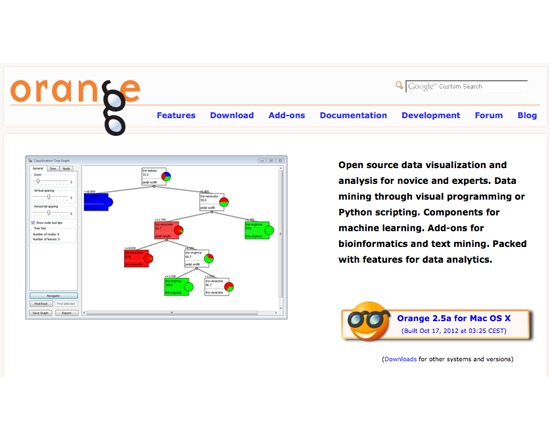
Orange is a free, open source data visualization and analysis tool. It allows users to conduct data mining either through its visual programming language, or via Python scripts, and includes components for machine learning. Orange includes both add-ons for biometrics and text mining, and data analytic features.
Week of 1 Nov – 7 Nov
Three tools from the catalogue, each rated at least 3 stars. A new set appears each Sunday.
Curated list created by experience authors in the fields.

Geoffrey Rockwell
Not all Voyant tools show up in the default view or skin. Here is a list of some of the other tools worth trying.
4 tools
View list
Holly Pickering
Interested in audio production and editing? Here are a few programs that can help you get on your way. Some of them are free, some not, but all are helpful and useful.
3 tools
View list
Jason Bradshaw
This list compiles a suite of tools that make up Kynan Ly's Text Analysis for Twitter Research (TATR) Library. Recipes to these notebooks can be found on methodi.ca
6 tools
View list1321
Tools catalogued
15
Curated lists
22
Analysis types
671
Community reviews
Researchers, power users, and students will soon be able to contribute tools, share reviews, and curate lists around their own work.