Skip to content
TAPoR Text Analysis Portal for Research

For researchers who work with text

Find a text analysis tool that fits the work.

TAPoR catalogues concordancers, annotators, topic models, stylometry packages, and visualization environments. Every record notes the platform, the license, and what the tool is actually good for.

  • Platform, license, and method on every record
  • Reviews from people who teach with the tools
  • Lists assembled around a course or a corpus

Browse tools

Filter by the type of analysis.

View all tools
‹

Visualization

Voyant Knots

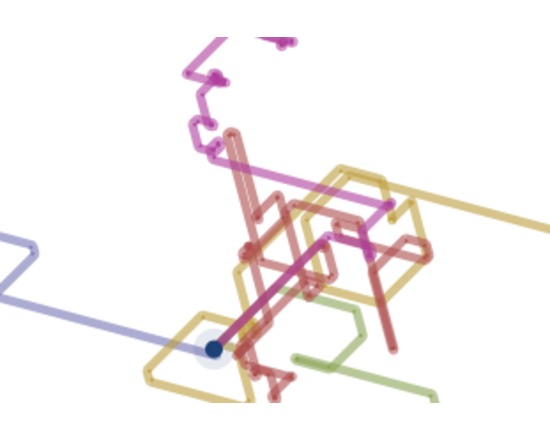
Knots is a visualization tool that helps to understand patterns of word relevance in one or more documents. Each term is represented as a twisted line – when the lines overlap it means a relevance or linkage within the terms.

Rated 5.0 out of 5.

Visualization

Voyant Tools 2.0 (Corpus View)

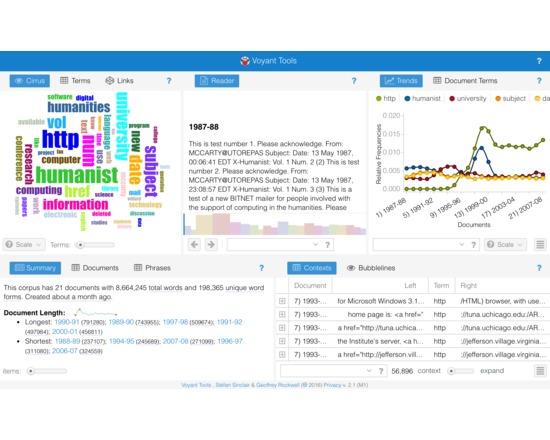
Voyant 2.0 is a complete rewrite of Voyant. It provides a suite of text analysis tools that will work with most texts you can upload or find on the web. These tools are combined in skins. For documentation see Documentation for Voyant 2.0

Rated 5.0 out of 5.

Visualization

Complex Sentiment Analysis

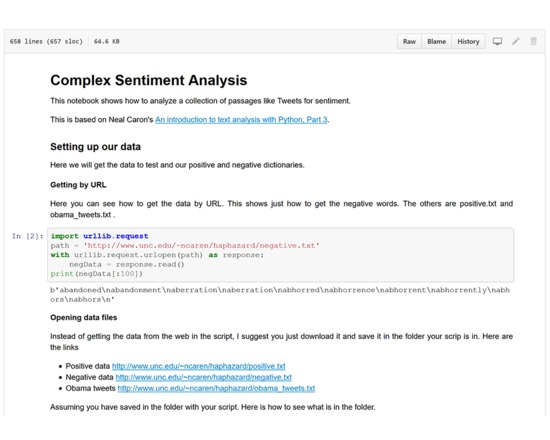
Code from an iPython notebook, based on: http://nealcaren.web.unc.edu/an-introduction-to-text-analysis-with-python-part-3/ This notebook shows how to conduct sentiment analysis on a collection of passages (e.g. Tweets) using dictionaries of positive and negative words.

Rated 4.0 out of 5.

Visualization

LodLive

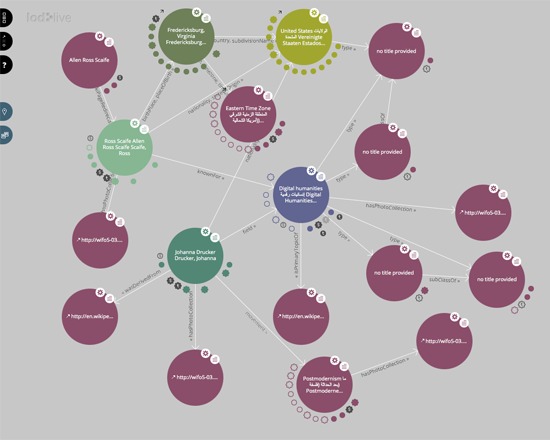
LodLive is a web-based tool developed to demonstrate Linked Data standards applied to browsing RDF resources with a simple interface. Users can search preset datasets, including DBpedia and Freebase, or search a resource available at a web address of the user's choice. LodLive is also available for download.

Rated 4.0 out of 5.

Visualization

R

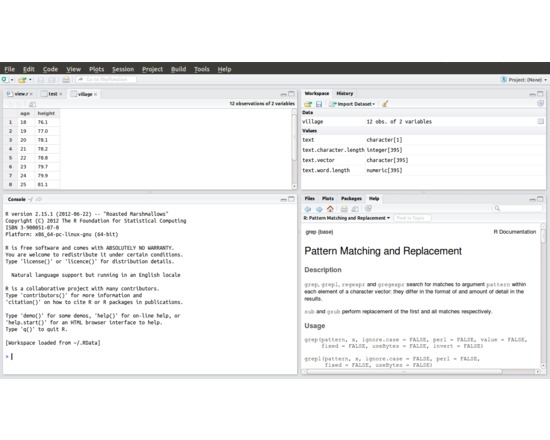
R is an open source programing language designed for statistical analysis and parallel computing. R began its life as a research project at the University of Aukland, but has since expanded to become a collaborativly run open source project run by the GNU. R has libraries for data import, regular expression data splitting, and visualization of data. R can be run as either a script or as a working environment.

Rated 4.0 out of 5.

Visualization

Visualizing Literature: Virtue and Vice

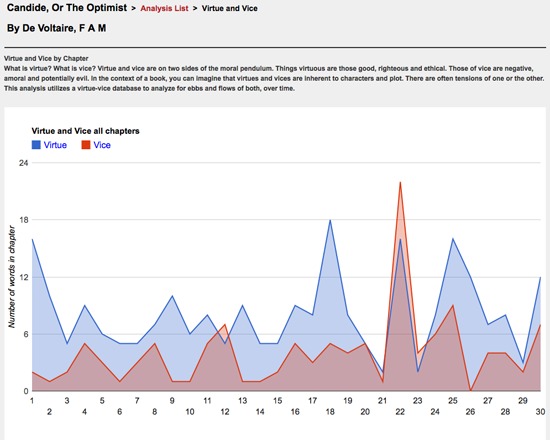
Virtue and Vice, from the Visualizing Literature toolset, allows users to select a text from Visualizing Literature's list of grade school curriculum exemplar creative commons texts and graph out all instances of words suggestive of virtue and vice within the text. All texts are searchable, and can be sorted by writer, title, publication year, grade level, availability for analysis and availablility of a direct link to the text. Please note that, as this toolset is still in beta, the selection of texts is currently limited, though over 300 texts are forthcoming. As of 2014, this toolset is no longer available as the website has been taken down. It may still be viewed via the Internet Archive.

Rated 4.0 out of 5.

›

Curated lists

Curated list created by experience authors in the fields.

All curated lists

Geoffrey Rockwell

Cool Voyant Tools

Not all Voyant tools show up in the default view or skin. Here is a list of some of the other tools worth trying.

4 tools

View list

Holly Pickering

Audio Production Software

Interested in audio production and editing? Here are a few programs that can help you get on your way. Some of them are free, some not, but all are helpful and useful.

3 tools

View list

Jason Bradshaw

TATR: Text Analysis for Twitter Research

This list compiles a suite of tools that make up Kynan Ly's Text Analysis for Twitter Research (TATR) Library. Recipes to these notebooks can be found on methodi.ca

6 tools

View list

The catalogue

  • 1321

    Tools catalogued

  • 15

    Curated lists

  • 22

    Analysis types

  • 671

    Community reviews

More is coming

Researchers, power users, and students will soon be able to contribute tools, share reviews, and curate lists around their own work.