Skip to content
TAPoR Text Analysis Portal for Research

For researchers who work with text

Find a text analysis tool that fits the work.

TAPoR catalogues concordancers, annotators, topic models, stylometry packages, and visualization environments. Every record notes the platform, the license, and what the tool is actually good for.

  • Platform, license, and method on every record
  • Reviews from people who teach with the tools
  • Lists assembled around a course or a corpus

Browse tools

Filter by the type of analysis.

View all tools
‹

Visualization

ProcessingJS

ProcessingJS is an open source visual programming language for the work with data visualization, electronic arts and visual design communities. It operates under the web standards and doesn’t require any plug-ins. The tool promotes visual esthetics of computer programming on the web. ProcessingJS is a sister project to Processing .
Rated 0.0 out of 5.

Visualization

Project Quincy

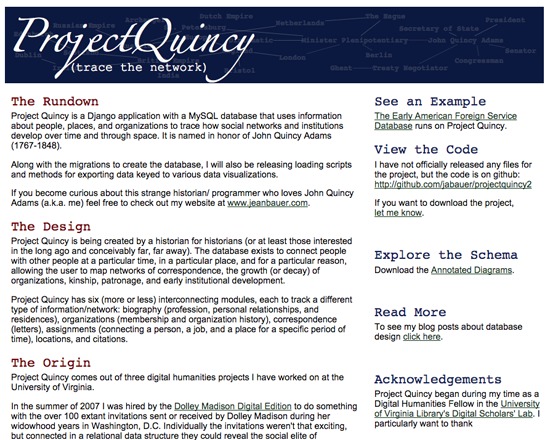
Project Quincy is a free, open source Django application and MySQL database for tracing the development of social networks and instititions across time and space. Aimed at historians, it enables users to map networks in historical documentation such as biographic, organizational, correspondance or location. Creator Jean Bauer has developed Project Quincy as a single generalizable and extensible database with applications beyond mapping historic connections. All code is available via Github repository, or by contacting the creator directly.

Rated 0.0 out of 5.

Visualization

Prospect

Prospect is a free, open-source data curation and visualization plugin for WordPress, developed by the Digital Innovation Lab at UNC Chapel Hill. Data can be entered into Prospect by importing a formatted CSV file or entering it via a form created automatically by Prospect. Data collections can be inserted into WordPress pages or displayed in visualizations that allow users to explore information space, interpret patterns and access materials.

Rated 0.0 out of 5.

Visualization

Protovis

Protovis composes custom views of data with simple marks such as bars and dots. Unlike low-level graphics libraries that quickly become tedious for visualization, Protovis defines marks through dynamic properties that encode data, allowing inheritance, scales and layouts to simplify construction. Protovis is free and open-source, provided under the BSD License. It uses JavaScript and SVG for web-native visualizations; no plugin required (though you will need a modern web browser)! Although programming experience is helpful, Protovis is mostly declarative and designed to be learned by example. Protovis is no longer being developed. The developers have moved on to a new visualization library, D3.

Rated 0.0 out of 5.

Visualization

Ptolemaic

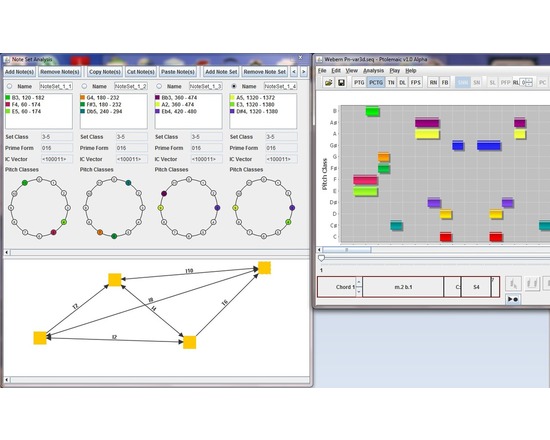
Ptolemaic is a computer application for music visualization and analysis written in the Java programming language. The software is designed to aid in the analysis of all types of Western music using established analytical techniques, including tonal functional analysis (Harrison 1994), pitch-class set analysis (Forte 1973), hierarchical linear analysis (Schenker 1935, Jones 2002), tonal pitch-space analysis on the Tonnetz (Riemann 1915), pitch-class set analysis (Forte 1973), and transformation analysis (Lewin 1987). Musical works and excerpts may be opened and saved using the de-facto standard music notation interchange format, MusicXML. To assist in analysis, Ptolemaic can display the music on a pitch/time graph, on a pitch-class/time graph, on a step-class/time graph (also called a diatonic lattice) (Jones 2002), on the Tonnetz, or using filtered point-symmetry (Douthett 2008). Pitch classes and chords are color coded so that the user can easily correlate them across each graph. The benefit of having a software tool to visualize and perform certain analysis tasks is in automating processes that are normally time-consuming for the musician, thus allowing the music scholar to focus on the musical issues, rather than the technical issues of graphing, and calculating chord classes. Ptolemaic provides useful ways of visualizing a piece of music and tools for gaining more information about that music, so that the user can efficiently make informed musical decisions about the music and preserve that analysis for future study.

Rated 0.0 out of 5.

Visualization

Quadrigram

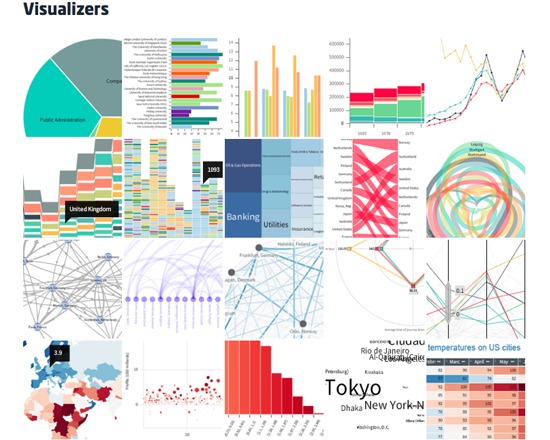
Quadrigram is an environment for data gathering, query and visualization, based on a visual programming language and intended for users with no experience programming or creating visualizations. At present, it contains 50 different visualizers.

Rated 0.0 out of 5.

›

Curated lists

Curated list created by experience authors in the fields.

All curated lists

Geoffrey Rockwell

Cool Voyant Tools

Not all Voyant tools show up in the default view or skin. Here is a list of some of the other tools worth trying.

4 tools

View list

Holly Pickering

Audio Production Software

Interested in audio production and editing? Here are a few programs that can help you get on your way. Some of them are free, some not, but all are helpful and useful.

3 tools

View list

Jason Bradshaw

TATR: Text Analysis for Twitter Research

This list compiles a suite of tools that make up Kynan Ly's Text Analysis for Twitter Research (TATR) Library. Recipes to these notebooks can be found on methodi.ca

6 tools

View list

The catalogue

  • 1321

    Tools catalogued

  • 15

    Curated lists

  • 22

    Analysis types

  • 671

    Community reviews

More is coming

Researchers, power users, and students will soon be able to contribute tools, share reviews, and curate lists around their own work.