Skip to content
TAPoR Text Analysis Portal for Research

For researchers who work with text

Find a text analysis tool that fits the work.

TAPoR catalogues concordancers, annotators, topic models, stylometry packages, and visualization environments. Every record notes the platform, the license, and what the tool is actually good for.

  • Platform, license, and method on every record
  • Reviews from people who teach with the tools
  • Lists assembled around a course or a corpus

Browse tools

Filter by the type of analysis.

View all tools
‹

Visualization

Wordle

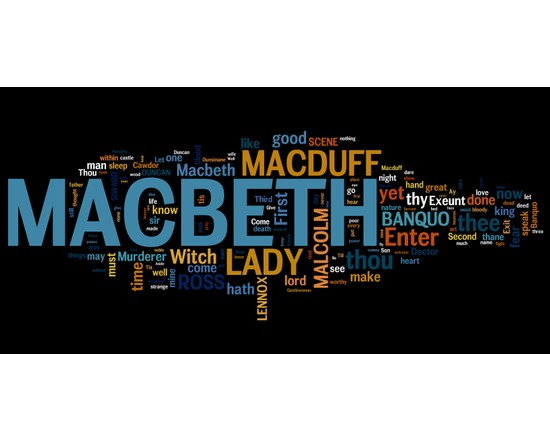
Wordle is an online toy for generating word clouds using the text you provide. Text can be submitted by providing an URL or by pasting raw text into an input. The most frequent words from the text are then used as the source for the resulting visualization, where frequency is used to determine the size of each word. You may customize the output by choosing from a variety of display options (layout, font, colours) or use the randomize feature to get a random visualization. Additionally, there is built-in stop word support for many common languages, and the option to change the word case.

Rated 4.0 out of 5.

Visualization

GATE (General Architecture for Text Engineering)

GATE (General Architecture for Text Engineering) is free, open source software offered by the University of Sheffield since 1995. It provides a framework for users to gather a corpus, apply an ontology to it, develop markup, automate the application of the markup to the corpus and add tools such as knowledge facet search, ontology browsing or graphing.

Rated 3.0 out of 5.

Visualization

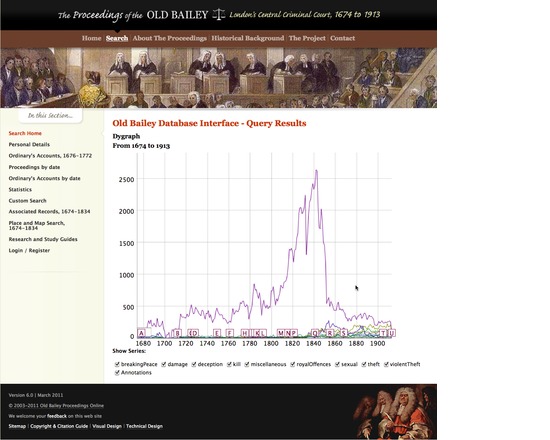
Old Bailey Data Warehousing Interface

This prototype was produced as a proof-of-concept for the Criminal Intent project. It allows the records of the Old Bailey Online project to be searched such that the returned results can be viewed as either a timeline or a concordance of terms. The tool allows for reasonably complex queries to be placed and a range of different formats for the returned charts to be selected. The tool is primarily built with Python and SQLite and makes use of the Google Chart API for some output options.

Rated 3.0 out of 5.

Visualization

Voyant FeatureClusters (beta)

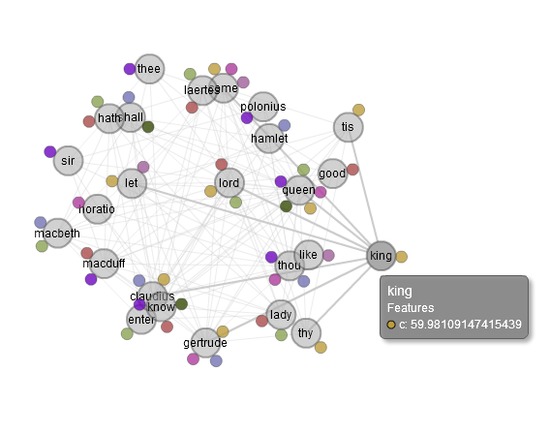
FeatureClusters is a visualization tool for viewing associations between words, based on commonalities in the feature sets of the words. This is illustrated using a force-directed graph, wherein each word is a node in the graph. Nodes are connected to one another if they share the same feature. Features are represented by the smaller circles (or petals) which surround each word. Moving your mouse over a word will show the feature details associated with that word. Clicking on a word will highlight its connections to other words.

Rated 3.0 out of 5.

Visualization

Voyant Links

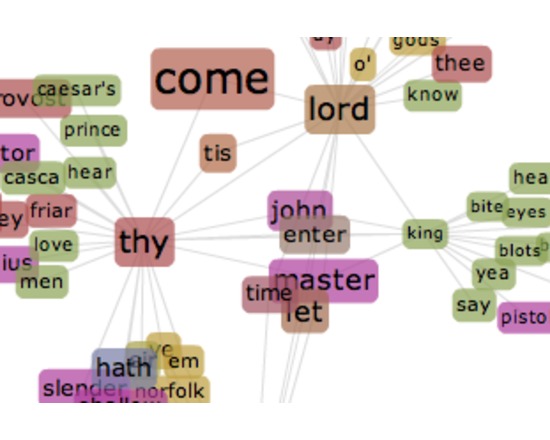
Links finds collocates for words and displays links between them using a force directed graph. It shows term frequencies in proximity to keyword. It is a visualization and shows a web of terms.

Rated 3.0 out of 5.

Visualization

Voyant ScatterPlot

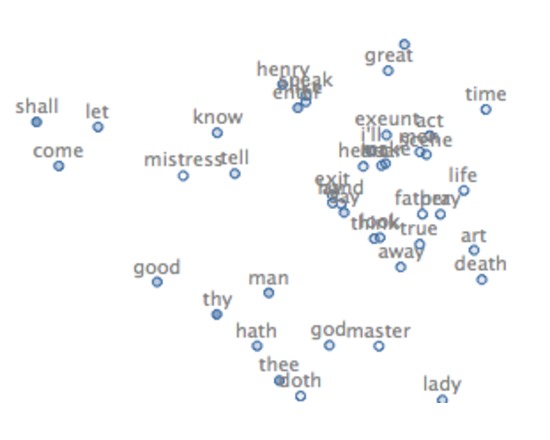
ScatterPlot creates a scatter plot graph of terms, spaced by their variation from one another. Once you arrive to ScatterPlot, insert / upload your content and let the tool perform its analysis. You may hover over these dots and click on them for more information.

Rated 3.0 out of 5.

›

Curated lists

Curated list created by experience authors in the fields.

All curated lists

Geoffrey Rockwell

Cool Voyant Tools

Not all Voyant tools show up in the default view or skin. Here is a list of some of the other tools worth trying.

4 tools

View list

Holly Pickering

Audio Production Software

Interested in audio production and editing? Here are a few programs that can help you get on your way. Some of them are free, some not, but all are helpful and useful.

3 tools

View list

Jason Bradshaw

TATR: Text Analysis for Twitter Research

This list compiles a suite of tools that make up Kynan Ly's Text Analysis for Twitter Research (TATR) Library. Recipes to these notebooks can be found on methodi.ca

6 tools

View list

The catalogue

  • 1321

    Tools catalogued

  • 15

    Curated lists

  • 22

    Analysis types

  • 671

    Community reviews

More is coming

Researchers, power users, and students will soon be able to contribute tools, share reviews, and curate lists around their own work.