Skip to content
TAPoR Text Analysis Portal for Research

For researchers who work with text

Find a text analysis tool that fits the work.

TAPoR catalogues concordancers, annotators, topic models, stylometry packages, and visualization environments. Every record notes the platform, the license, and what the tool is actually good for.

  • Platform, license, and method on every record
  • Reviews from people who teach with the tools
  • Lists assembled around a course or a corpus

Browse tools

Filter by the type of analysis.

View all tools
‹

Visualization

Stanford Mobisocial Lab: Muse

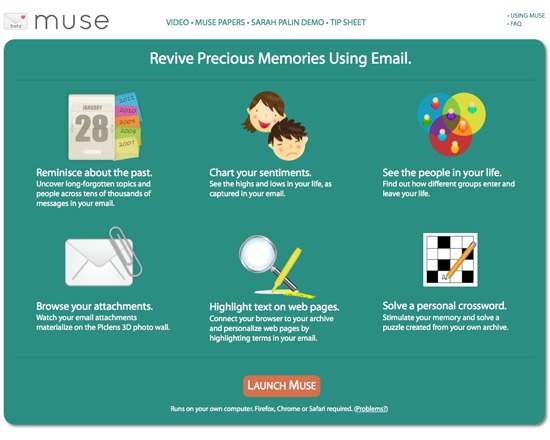
Muse is a free, open source JavaScript tool for reflecting on and searching for patterns in the past by examining one's personal e-mail archive. It analyses e-mail to generate several views including a sentiment graph from messages that may reflect particular emotions or feelings, inferred groups based on communications with various contacts, a calendar view, or an an attachment wall of all documents attached to e-mails.
Rated 0.0 out of 5.

Visualization

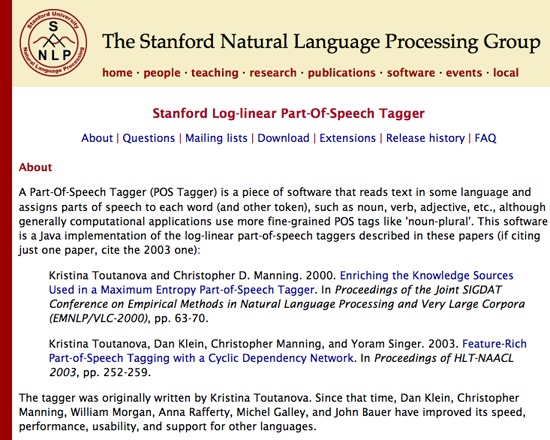
Stanford NLP Group: Part-of-Speech Tagger

Stanford Part-of-Speech Tagger is a free Java implementation for the recognition of parts of speech, and a part of the Stanford Natural Language Processing toolset. It reads text and assigns parts of speech to each word such as noun, verb or adjective. This tool can be used with English, French, Arabic and German text.

Rated 0.0 out of 5.

Visualization

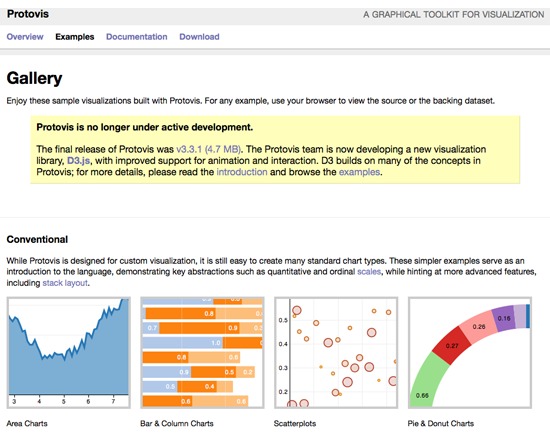
Stanford Vis Group: Protovis

Protovis is a free, open source tool for composing custom views of data from simple elements such as bars or dots. Marks are defined through dynamic properties to allow inheritance, scales and layouts for simplified visualization construction. This tool uses JavaScript and SVG in order to ensure web-native visualizations. Protovis is no longer under active construction; many of the concepts used in its development have been implemented in its successor, D3.js.

Rated 0.0 out of 5.

Visualization

Statwing

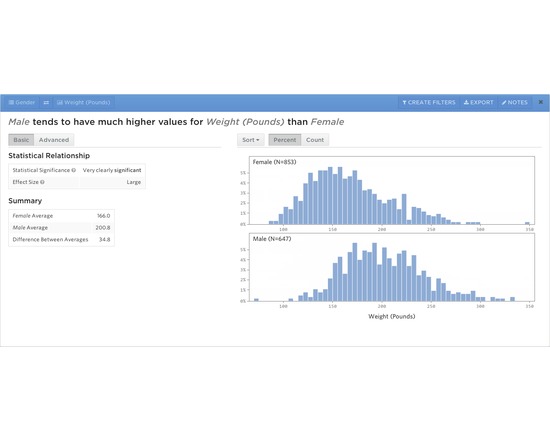
Statwing is an easy-to-use, web-based tool for data analysis and visualization. Upload data, select variables of interest, and Statwing automatically selects statistical tests and visualizations, then distills the results into plain English sentences (as well as traditional statistical output for those so inclined). Free trial available, as well as multiple pricing plans: Statwing Silver — $50/month (unlimited datasets up to 50 MB each) Statwing Gold — $100/month (unlimited datasets up to 500 MB each) Statwing Enterprise — Inquire for cost (unlimited datasets up to 5 GB each, optional on-premise deploy)

Rated 0.0 out of 5.

Visualization

StoryMapJS

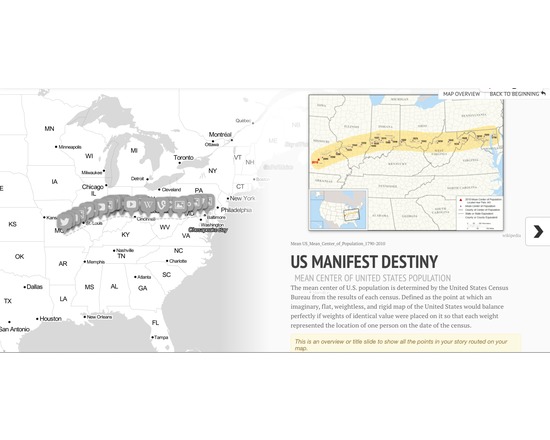
StoryMapJS is a project by KnightLab which aims to help journalists and historians tell stories by using maps using a straight-forward and simple authoring tool. It is constructed around a framework of highlighting the locations of a series of events. As an editing tool, it is relatively intuitive and easy to use.

Rated 0.0 out of 5.

Visualization

SylvaDB

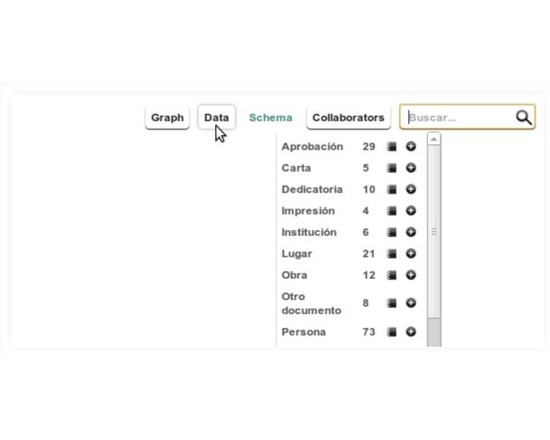
SylvaDB is a graph database management system. It allows users with no knowledge in graph theory to model, collect, query, and analyze data in a network structure. SylvaDB provides tools for easy creation of schemas and modelling, automatic forms creation to input the data, collaborative features, a visual query editor, global and local search, reports charts generation, networks metrics, and visualizations tools.

Rated 0.0 out of 5.

›

Curated lists

Curated list created by experience authors in the fields.

All curated lists

Geoffrey Rockwell

Cool Voyant Tools

Not all Voyant tools show up in the default view or skin. Here is a list of some of the other tools worth trying.

4 tools

View list

Holly Pickering

Audio Production Software

Interested in audio production and editing? Here are a few programs that can help you get on your way. Some of them are free, some not, but all are helpful and useful.

3 tools

View list

Jason Bradshaw

TATR: Text Analysis for Twitter Research

This list compiles a suite of tools that make up Kynan Ly's Text Analysis for Twitter Research (TATR) Library. Recipes to these notebooks can be found on methodi.ca

6 tools

View list

The catalogue

  • 1321

    Tools catalogued

  • 15

    Curated lists

  • 22

    Analysis types

  • 671

    Community reviews

More is coming

Researchers, power users, and students will soon be able to contribute tools, share reviews, and curate lists around their own work.