Visualization
Textometrica
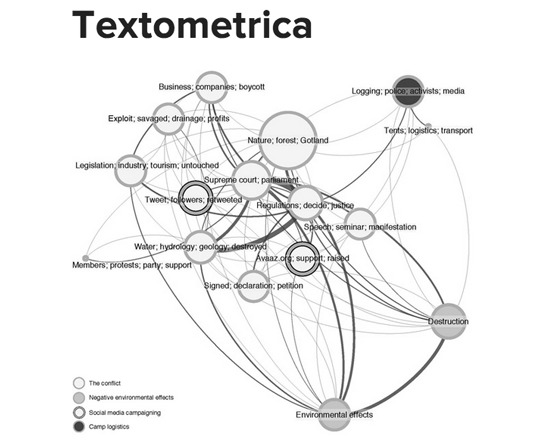
Textometrica is a free, web based text analysis tool offered by HUMlab at Umeå University. Users can upload a plain-text file and examine its word frequencies, see co-occurrences, and generate visualizations and graphs.
For researchers who work with text
TAPoR catalogues concordancers, annotators, topic models, stylometry packages, and visualization environments. Every record notes the platform, the license, and what the tool is actually good for.
Filter by the type of analysis.
Visualization
Textometrica is a free, web based text analysis tool offered by HUMlab at Umeå University. Users can upload a plain-text file and examine its word frequencies, see co-occurrences, and generate visualizations and graphs.

Visualization
Community textual editing tool that runs as a service over the web. Alllows one to see manuscript image and edit the XML. Also provides collation tools.
Visualization
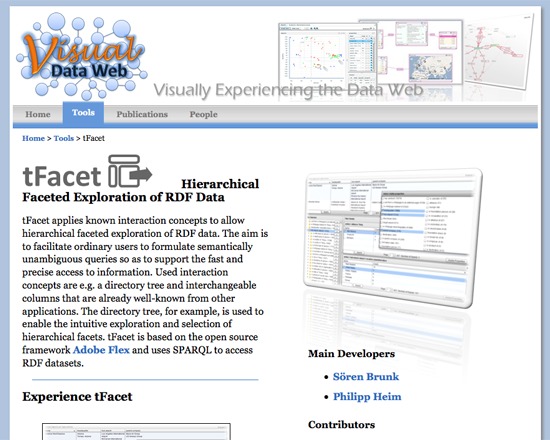
tFacet applies known interaction concepts to allow hierarchical faceted exploration of RDF data. The aim is to facilitate ordinary users to formulate semantically unambiguous queries so as to support the fast and precise access to information. Used interaction concepts are e.g. a directory tree and interchangeable columns that are already well-known from other applications. The directory tree, for example, is used to enable the intuitive exploration and selection of hierarchical facets. tFacet is based on the open source framework Adobe Flex and uses SPARQL to access RDF datasets.
Visualization
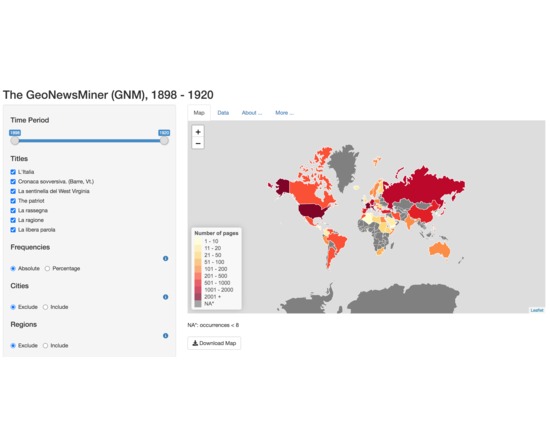
This is a project that had as goal to show on a map the references to geographical location from the text of publications from Italian language newspapers published in the United States between 1898 and 1920. They have made the code and dataset publicly available on GitHub and hence can be used by scholars with a similar project. A review of this project is available here https://utrecht-university.shinyapps.io/GeoNewsMiner/
Visualization
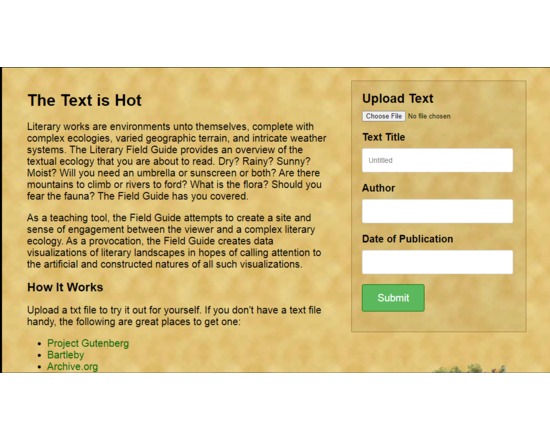
The Literary Field Guide provides an overview of the textual ecology of the text that you are about to read. It identifies mentions of ecological terms in the text and outputs an image that represents the environment the ecological terms of the text suggest. It also outputs the mentions and their frequencies under specific headings (for example: fauna, flora, amphibians, trees, landscapes, etc )
Visualization
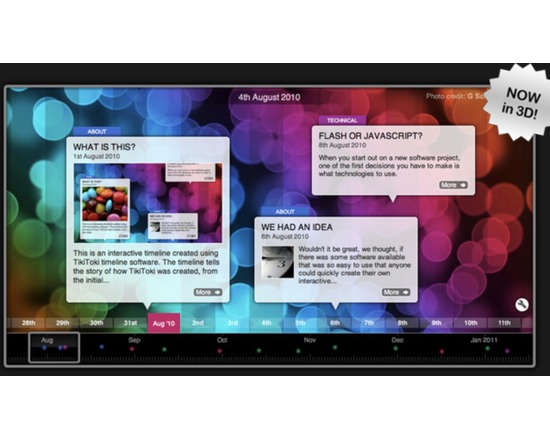
Tiki-Toki provides users with the ability to create interactive and stylish timelines either through a web application or through a desktop app. Timelines created through the web interface can be shared or embedded. Timelines created through the desktop app are only available locally, and can be used for presentations, or for creating timelines using data that you wish to store locally. Users with a free account can create one timeline that can't be embedded. Paid users can create multiple timelines that can be embedded, as well as edited by multiple users.
Week of 1 Nov – 7 Nov
Three tools from the catalogue, each rated at least 3 stars. A new set appears each Sunday.
Curated list created by experience authors in the fields.

Geoffrey Rockwell
Not all Voyant tools show up in the default view or skin. Here is a list of some of the other tools worth trying.
4 tools
View list
Holly Pickering
Interested in audio production and editing? Here are a few programs that can help you get on your way. Some of them are free, some not, but all are helpful and useful.
3 tools
View list
Jason Bradshaw
This list compiles a suite of tools that make up Kynan Ly's Text Analysis for Twitter Research (TATR) Library. Recipes to these notebooks can be found on methodi.ca
6 tools
View list1321
Tools catalogued
15
Curated lists
22
Analysis types
671
Community reviews
Researchers, power users, and students will soon be able to contribute tools, share reviews, and curate lists around their own work.