Skip to content
TAPoR Text Analysis Portal for Research

For researchers who work with text

Find a text analysis tool that fits the work.

TAPoR catalogues concordancers, annotators, topic models, stylometry packages, and visualization environments. Every record notes the platform, the license, and what the tool is actually good for.

  • Platform, license, and method on every record
  • Reviews from people who teach with the tools
  • Lists assembled around a course or a corpus

Browse tools

Filter by the type of analysis.

View all tools
‹

Visualization

TileMill

Open source map design studio for creating and styling web tile maps, based on either provided free MapBox Geodata, or data imported as a variety of file formats. It uses the CartoCSS styling language to customize interactive visualizations, with powerful control of symbols, zoom levels, labels, and other cartographic details. The finished maps can be exported either as images or tiled web maps. Though the TileMill software is free, there may be a fee to host the created tiles on MapBox or elsewhere.
Rated 0.0 out of 5.

Visualization

Timeflow

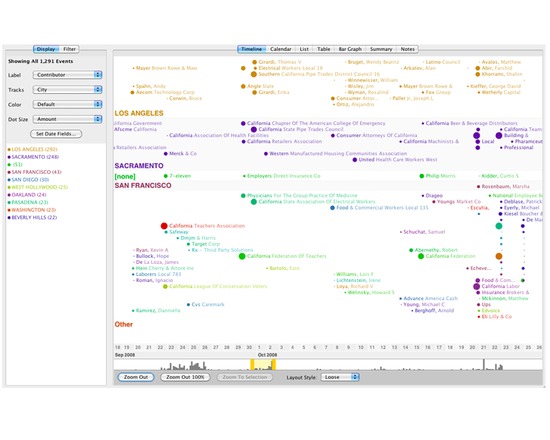
Time Flow is an open-source timeline built to help journalists analyze temporal data. The application offers several view modes--timeline, calendar, list, table--to help explore thousands of data points. It is not a web-based tool--it is a desktop application that can run off a thumb-drive and is built to handle large datasets, and timeline events that may include approximate dates or date spans. The project is in the alpha stage of development, but is available for download from Github.

Rated 0.0 out of 5.

Visualization

TimeGlider

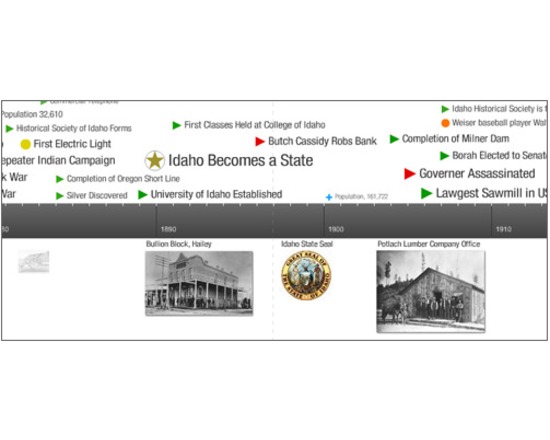
TimeGlider is a data-driven interactive timeline application built using JavaScript. You can "grab" the timeline and drag it left and right, and zoom in and out to view centuries at a time or just hours. TimeGlider allows you to create event-spans so that you can see durations and how they overlap. Being web-based, TimeGlider lets you collaborate and share easily.

Rated 0.0 out of 5.

Visualization

Timeline JS

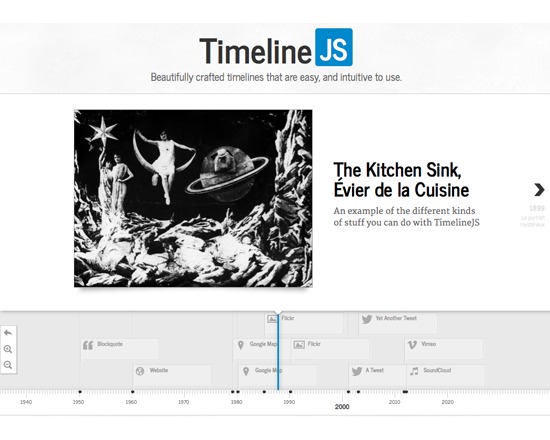
Timeline JS is a free timeline tool that can be poplulated from either a Google spreadsheet or a JSON file, and can draw media material from a variety of sources, such as Twitter, Flickr, Wikipedia, YouTube and more. It has been designed to be both easy to use and easy to embed the results in another web page.

Rated 0.0 out of 5.

Visualization

timemap

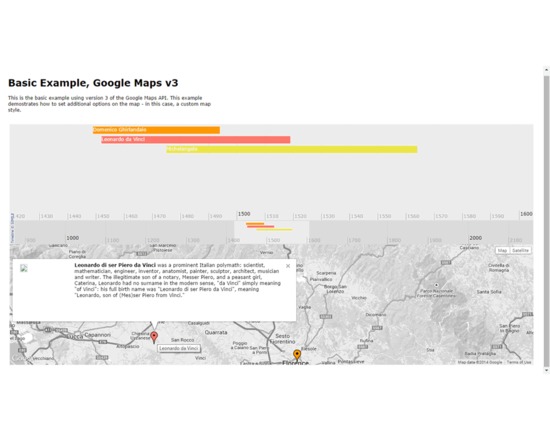
Timemap.js is a Javascript library that helps you to produce online maps (such as Google, OpenLayers, and Bing) along with a SIMILE timeline. You can load one or more datasets (in JSON, KML, or GeoRSS) onto both a map and a timeline simultaneously. By default, only items in the visible range of the timeline are displayed on the map.

Rated 0.0 out of 5.

Visualization

TimeMapper

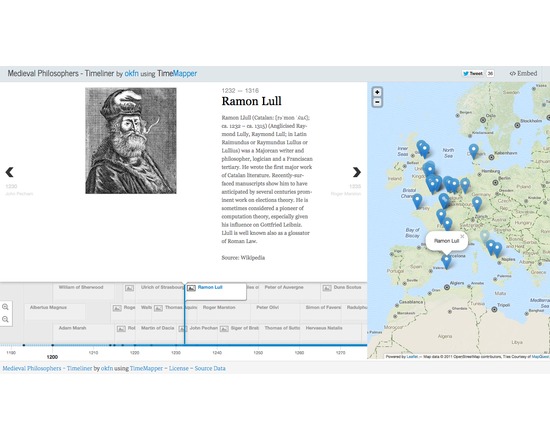
TimeMapper is an open source timeline tool that takes information in a Google spreadsheet and uses it to generate a timeline that can then be published, shared, or embedded on the web. It utilizes components from other open source tools like TimelineJS and Leaflet maps. It is simple to use, but not easily customizable.

Rated 0.0 out of 5.

›

Curated lists

Curated list created by experience authors in the fields.

All curated lists

Geoffrey Rockwell

Cool Voyant Tools

Not all Voyant tools show up in the default view or skin. Here is a list of some of the other tools worth trying.

4 tools

View list

Holly Pickering

Audio Production Software

Interested in audio production and editing? Here are a few programs that can help you get on your way. Some of them are free, some not, but all are helpful and useful.

3 tools

View list

Jason Bradshaw

TATR: Text Analysis for Twitter Research

This list compiles a suite of tools that make up Kynan Ly's Text Analysis for Twitter Research (TATR) Library. Recipes to these notebooks can be found on methodi.ca

6 tools

View list

The catalogue

  • 1321

    Tools catalogued

  • 15

    Curated lists

  • 22

    Analysis types

  • 671

    Community reviews

More is coming

Researchers, power users, and students will soon be able to contribute tools, share reviews, and curate lists around their own work.