Skip to content
TAPoR Text Analysis Portal for Research

For researchers who work with text

Find a text analysis tool that fits the work.

TAPoR catalogues concordancers, annotators, topic models, stylometry packages, and visualization environments. Every record notes the platform, the license, and what the tool is actually good for.

  • Platform, license, and method on every record
  • Reviews from people who teach with the tools
  • Lists assembled around a course or a corpus

Browse tools

Filter by the type of analysis.

View all tools
‹

Visualization

Viewshare

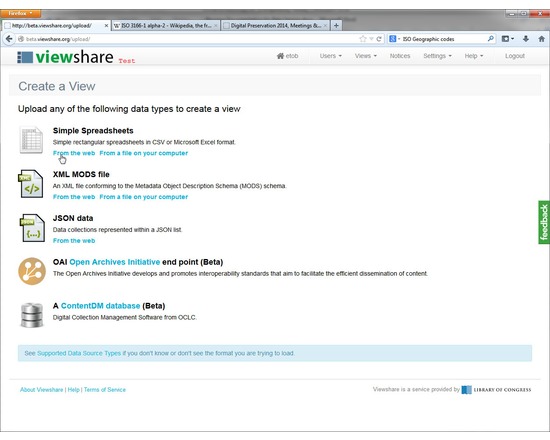
Viewshare is a free web application for creating interfaces and visualizations of cultural heritage collections. It can create interactive maps, timelines, facets, tag clouds, histograms, and image galleries. The intended users of Viewshare are individuals managing and creating access to digital collections of cultural heritage materials. Viewshare is offered as a software as a service (SaaS), email ndiippaccess@loc.gov to request a free account. Import Collection Data: Ingest collections from spreadsheets, JSON, CONTENTdm, XML MODS or OAI records. Upload from your desktop or import them from a URL. Generate Views: Generate distinct interactive visual interfaces to your digital collections, including maps and timelines, and sophisticated faceted navigation Embed & Share:Copy/Paste to embed your visualization interface in any webpage. Provide your users with novel and intuitive ways to explore your content System Requirements: Viewshare makes every attempt to support the following Web browsers: Microsoft Internet Explorer v.7 & 8, Firefox v.3.x and Safari v.3.x. Opera v.9.x, Camino v.1.6.x, Firefox v.4.x, and Chrome v.14.x mostly work but are not as thoroughly tested and not officially supported. Internet Explorer v.6 does not work with some of the software used by Viewshare. Viewshare currently supports the US English (en-US) locale.
Rated 0.0 out of 5.

Visualization

Visual Browser

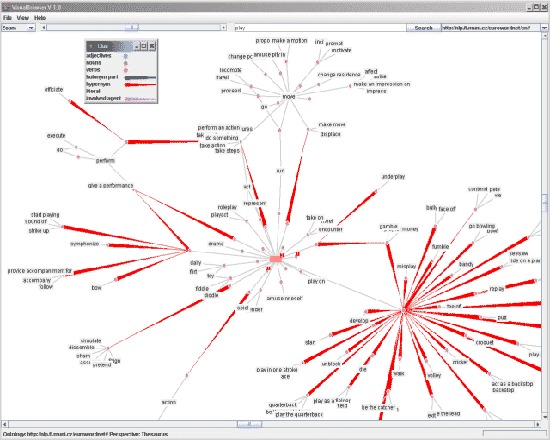
Visual Browser is a Java application for visualizing RDF data using the Jena framework. The resultant graphs are animated and permit users to expand and hide nodes and switch the view of edges, allowing them to focus on a small part of the network. The visualization engine is derived from TouchGraph LLC and follows the navigation approach of WebOFDAV, a system based on the concept of exploratory navigation to reduce chances of getting “lost in hyperspace” situation.

Rated 0.0 out of 5.

Visualization

Visual Understanding Environment (VUE)

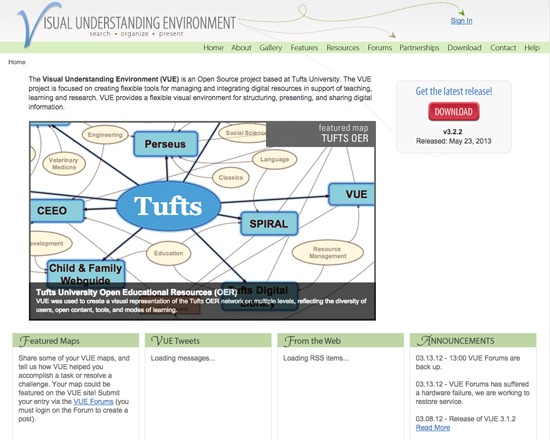
Visual Understanding Environment (VUE) is a free, open source application for mapping concepts, ideas and digital content. It enables users to generate nodes and links, and apply a simple set of tools to explore the relationships. VUE is, in the words of its developers, an application to "integrate, organize and contextualize electronic content" in research or learning environments. Its tools include visualization, dynamic content mapping, semantic mapping, enhanced pathways and search functions.

Rated 0.0 out of 5.

Visualization

visual.ly

Easy-to-use web-based software for creating infographics and data visualization, including a platform to share your work and discover works by others.

Rated 0.0 out of 5.

Visualization

VisualEyes

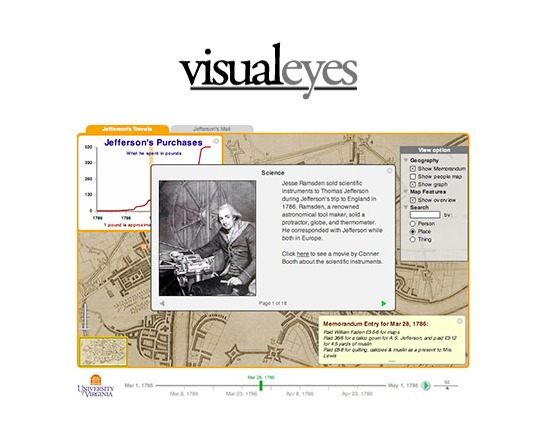
VisualEyes is web-based authoring tool for creating dynamic visualizations offered by the University of Virginia. It can be used to combine images, maps, charts, video and research data into a single visualization. It is comprehensively documented, including a reference guide to its XML structure and scripting, and to structuring data for inclusion.

Rated 0.0 out of 5.

Visualization

Visualize Free

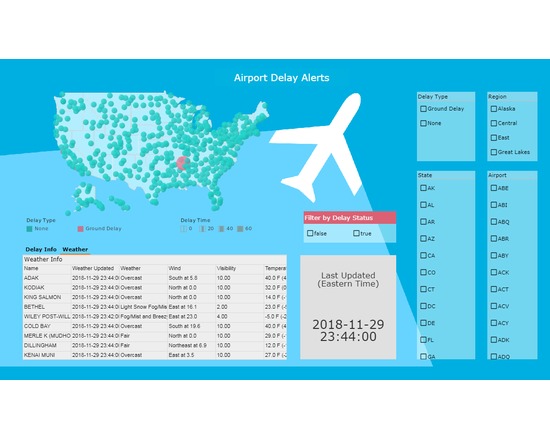
Visualize Free is a free cloud-hosted, zero-client app for data visualization and analytics. It is a derivative of the commercial platform for dashboard, reporting and data mashup developed by InetSoft. Simply upload your data and drag-and-drop to create visualization dashboards with built-in interactivity. Your private dashboards can be shared with others using a generated shareable link.

Rated 0.0 out of 5.

›

Curated lists

Curated list created by experience authors in the fields.

All curated lists

Geoffrey Rockwell

Cool Voyant Tools

Not all Voyant tools show up in the default view or skin. Here is a list of some of the other tools worth trying.

4 tools

View list

Holly Pickering

Audio Production Software

Interested in audio production and editing? Here are a few programs that can help you get on your way. Some of them are free, some not, but all are helpful and useful.

3 tools

View list

Jason Bradshaw

TATR: Text Analysis for Twitter Research

This list compiles a suite of tools that make up Kynan Ly's Text Analysis for Twitter Research (TATR) Library. Recipes to these notebooks can be found on methodi.ca

6 tools

View list

The catalogue

  • 1321

    Tools catalogued

  • 15

    Curated lists

  • 22

    Analysis types

  • 671

    Community reviews

More is coming

Researchers, power users, and students will soon be able to contribute tools, share reviews, and curate lists around their own work.