Skip to content
TAPoR Text Analysis Portal for Research

For researchers who work with text

Find a text analysis tool that fits the work.

TAPoR catalogues concordancers, annotators, topic models, stylometry packages, and visualization environments. Every record notes the platform, the license, and what the tool is actually good for.

  • Platform, license, and method on every record
  • Reviews from people who teach with the tools
  • Lists assembled around a course or a corpus

Browse tools

Filter by the type of analysis.

View all tools
‹

Visualization

YAGO

YAGO is a semantic knowledge base of over 10 million entities, and over 120 million facts about those entities, developed by the Max Planck Institut Informatik. Its base derives from Wikipedia, WordNet and GeoNames, and the accuaracy has not only been manually evaluated, but relations are also provided with an annotation stating its confidence value. The YAGO ontology includes spacial and temporal dimensions, and integrates WordNet's thematic domains as well. It can be queried or browsed right from the website, and the full ontology is available for download.
Rated 0.0 out of 5.

Visualization

yED Files

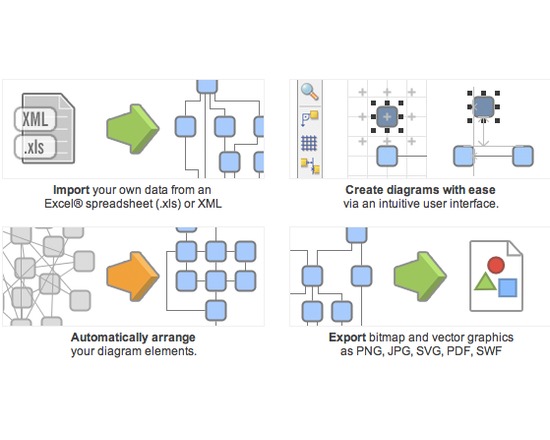
yWorks is a powerful set of tools for creating diagrams using any number of frameworks. There are tools for working with HTML, FLEX, AJAX, Silverlight, Java and .NET. yEd is also available from the yWorks site. This free graph editor can be used to create diagrams manually, or to import data for analysis.

Rated 0.0 out of 5.

Visualization

Yutzu

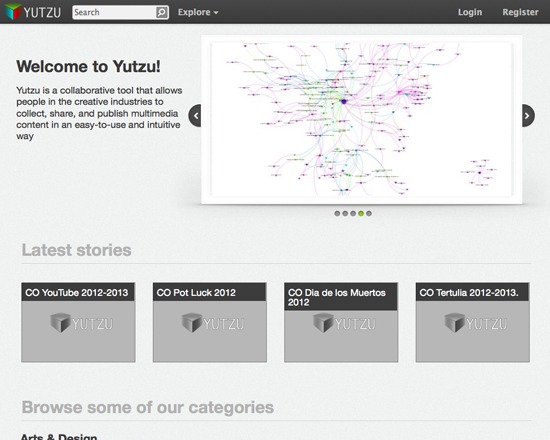
Yutzu is a collaborative tool for collecting and publishing multimedia content online, offered by the Cultureplex Lab at the University of Western Ontario. It is a web environment, designed to assist in the creative process, publication and visualization, and integrating a variety of multimedia tools. Yutzu has been used to showcase work, curate exhibitions and collections, and to facilitate teaching and learning.

Rated 0.0 out of 5.

Visualization

ZeeMaps

ZeeMaps quickly maps point data on Google base maps in two ways: 1) The user uploads a .csv file of data points and their locations. 2) A group of users all add their own data location points to the map, on their own time from their own devices. Each point can include text, video, image, or audio annotations. Basic functionality is free; larger uploads and large numbers of maps require a paid subscription.

Rated 0.0 out of 5.

Visualization

Zoomerang

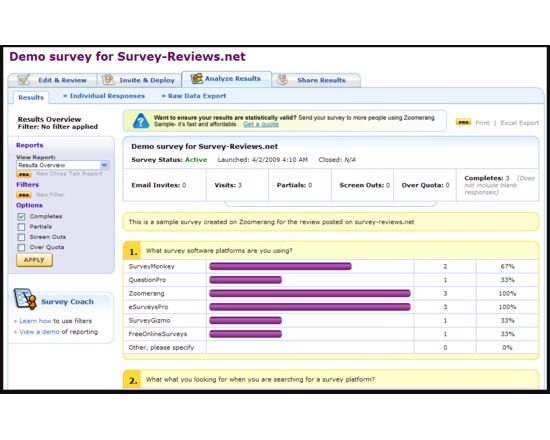
Zoomerang is online survey software. Users create and share their survey forms. It had the ability to export forms from Survey Monkey. It can be used for free but the paid plans include analysis tools. Zommerang is now part of Survey Monkey.

Rated 0.0 out of 5.

›

Curated lists

Curated list created by experience authors in the fields.

All curated lists

Geoffrey Rockwell

Cool Voyant Tools

Not all Voyant tools show up in the default view or skin. Here is a list of some of the other tools worth trying.

4 tools

View list

Holly Pickering

Audio Production Software

Interested in audio production and editing? Here are a few programs that can help you get on your way. Some of them are free, some not, but all are helpful and useful.

3 tools

View list

Jason Bradshaw

TATR: Text Analysis for Twitter Research

This list compiles a suite of tools that make up Kynan Ly's Text Analysis for Twitter Research (TATR) Library. Recipes to these notebooks can be found on methodi.ca

6 tools

View list

The catalogue

  • 1321

    Tools catalogued

  • 15

    Curated lists

  • 22

    Analysis types

  • 671

    Community reviews

More is coming

Researchers, power users, and students will soon be able to contribute tools, share reviews, and curate lists around their own work.