Skip to content
TAPoR Text Analysis Portal for Research

For researchers who work with text

Find a text analysis tool that fits the work.

TAPoR catalogues concordancers, annotators, topic models, stylometry packages, and visualization environments. Every record notes the platform, the license, and what the tool is actually good for.

  • Platform, license, and method on every record
  • Reviews from people who teach with the tools
  • Lists assembled around a course or a corpus

Browse tools

Filter by the type of analysis.

View all tools
‹

Visualization

Alteryx

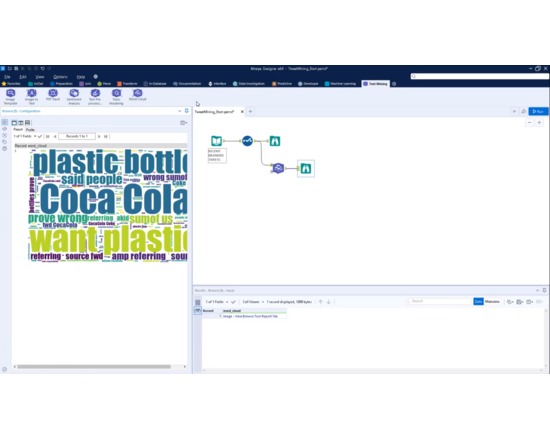
Alteryx is an online commercial data analysis service. Among its capabilities are optical character recognition, sentiment analysis, and topic modeling with Text Mining. You can quickly build predictive models without coding through its intuitive graphical user interface. It has many visualisation options among which is the word cloud.
Rated 0.0 out of 5.

Visualization

Analyse-it

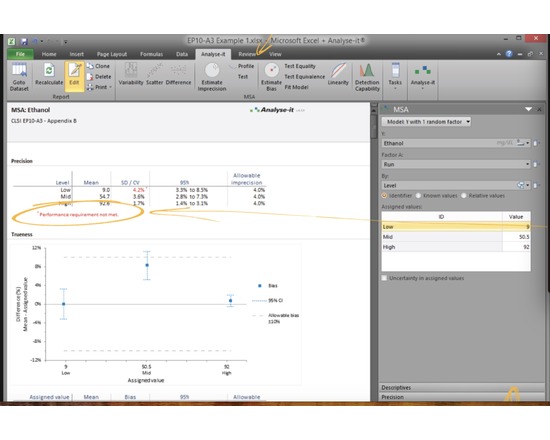
A set of dataset management and statistical plugins which is only available for Microsoft Windows including single and multiple linear regression, polynomial regression, and scatter plot with fit, fit confidence and prediction bands. The program can be used to generate visualizations and data reports. Requires Microsoft Excel.

Rated 0.0 out of 5.

Visualization

Analyse-it Method Validation Edition

Analyse-it Method Validation Edition provides the statistical analysis you need to validate and verify analytical and diagnostic methods to meet the demands of regulatory compliance. With support for 11 CLSI protocols, it lets you: • Validate or verify analytical performance characteristics (precision, trueness, linearity, interferences, detection capability) of a measurement procedure to ensure they meet requirements for intended use or manufacturer's claims. • Compare methods to establish the real-world performance of a method against a reference method, or ensure comparability between two methods when making changes. Includes Deming, Weighted Deming, and Passing-Bablok regression, plus Bland-Altman limits of agreement. • Evaluate the diagnostic ability of a test to discriminate between two outcomes and compare test performance to find the most effective one. Includes ROC curves and Delong-Delong Clarke Pearson curve comparisons. • Establish a reference interval for a population of healthy individuals, or verify that existing intervals are transferable between laboratories or measurement procedures. Includes normal, quantile, robust bi-weight quantile, bootstrapped quantile, & Harrell-Davis quantile reference ranges.

Rated 0.0 out of 5.

Visualization

Analyse-it Quality Control & Improvement Edition

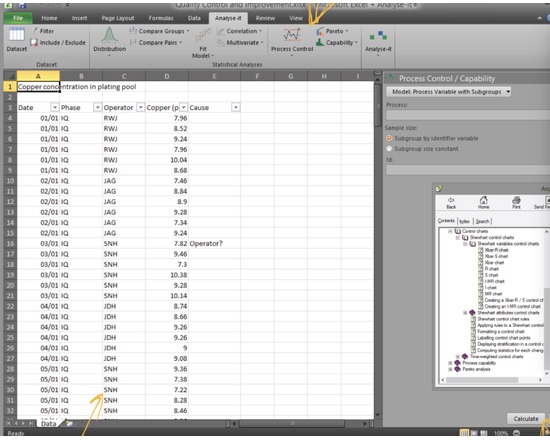
Analyse-it Quality Control & Improvement Edition provides the statistical analysis you need to understand processes, bring them under control, and find improvements that better your product. • Bring processes under statistical control so they are stable and predictable with powerful Shewhart, cumulative sum, and moving average control charts. Include Xbar-R, Xbar-S, R, S, I-MR, time weighted CUSUM, UWMA, EMA plots, and WECO, Nelson, Montomery or custom rulesets. • Ensure products are capable of meeting end-user specifications using capability indices to compare in-control process performance to your specification limits. • Improve processes and products by identifying solutions that really work using hypothesis tests and model fitting techniques. Includes ANOVA with multiple comparison, multiple linear and logistic regression, PCA and Factor analysis. • Identify actions that will reap the most rewards using Pareto analysis to identify commonly occurring defects and monitor them during process improvement.

Rated 0.0 out of 5.

Visualization

Analyse-it Standard Edition

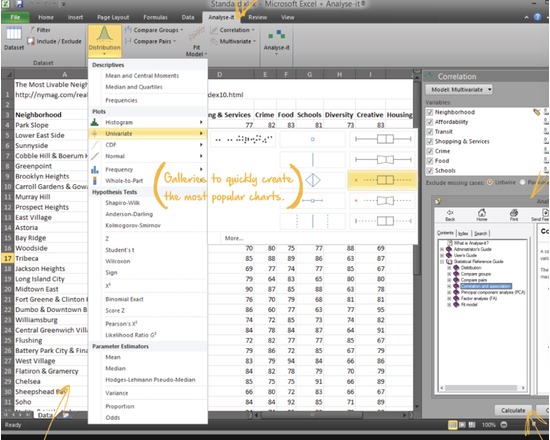
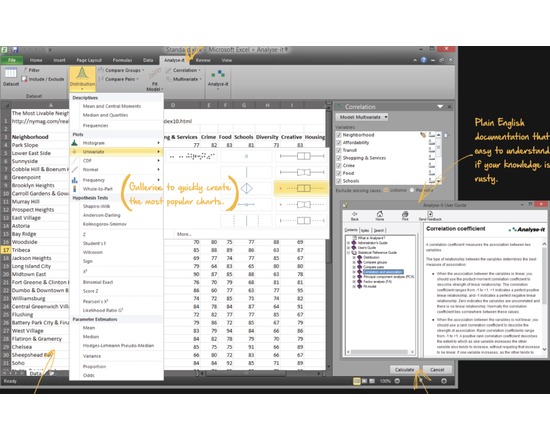
Analyse-it Standard Edition provides you with the powerful statistical analysis and regression you’d expect from an expensive statistics package, but without the complexity or the cost. • Describe your data with a wide range of statistics. • Visualize distributions, see trends and patterns, and spot outliers with powerful charts from histograms to scatter plots. • Infer and test hypotheses to get answers on distribution parameters, differences between populations, association between variables, and much more. Includes ANOVA, multiple comparisons, and an extensive range of parametric and non-parametric tests. • Discover relationships between variables and identify important factors with powerful regression and model fitting techniques. Include linear and logistic regression, with simple functions, or advanced models with crossed, polynomial and factorial terms. • Get insight into highly complex data by reducing dimensionality to get a clearer picture of the underlying structure. Includes correlation matrix, PCA (Principle Component Analysis) and Factor Analysis.

Rated 0.0 out of 5.

Visualization

ANNIS (ANNotation of Information Structure)

ANNIS (ANNotation of Information Structure), now in version 3.4.3, is an open source browser-based visualization architecture designed to annotate complex multilevel linguistic corpora. Now in its second version, ANNIS enables users to concurrently annotate, query and visualize data for syntax, semantics, morphology, prosody, referntiality, lexis and so forth. It also offers support for spoken language and audio and visual annotation.

Rated 0.0 out of 5.

›

Curated lists

Curated list created by experience authors in the fields.

All curated lists

Geoffrey Rockwell

Cool Voyant Tools

Not all Voyant tools show up in the default view or skin. Here is a list of some of the other tools worth trying.

4 tools

View list

Holly Pickering

Audio Production Software

Interested in audio production and editing? Here are a few programs that can help you get on your way. Some of them are free, some not, but all are helpful and useful.

3 tools

View list

Jason Bradshaw

TATR: Text Analysis for Twitter Research

This list compiles a suite of tools that make up Kynan Ly's Text Analysis for Twitter Research (TATR) Library. Recipes to these notebooks can be found on methodi.ca

6 tools

View list

The catalogue

  • 1321

    Tools catalogued

  • 15

    Curated lists

  • 22

    Analysis types

  • 671

    Community reviews

More is coming

Researchers, power users, and students will soon be able to contribute tools, share reviews, and curate lists around their own work.