Skip to content
TAPoR Text Analysis Portal for Research

For researchers who work with text

Find a text analysis tool that fits the work.

TAPoR catalogues concordancers, annotators, topic models, stylometry packages, and visualization environments. Every record notes the platform, the license, and what the tool is actually good for.

  • Platform, license, and method on every record
  • Reviews from people who teach with the tools
  • Lists assembled around a course or a corpus

Browse tools

Filter by the type of analysis.

View all tools
‹

Visualization

BookLamp Labs: Suggestion Viewer

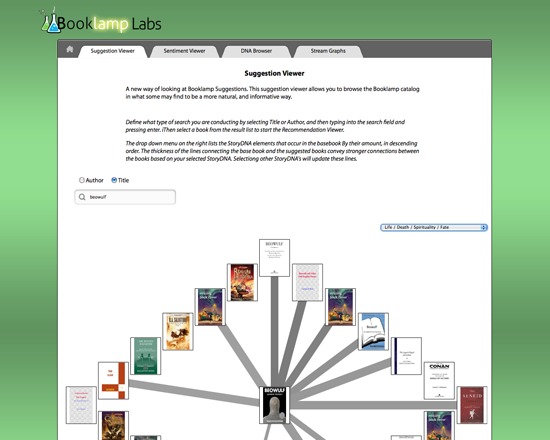
BookLamp's Suggestion Viewer is a faceted search and browser tool for finding new books based on how similar they are to another book. Users can search by either title or author and select the book to center the search on. The Suggestion Viewer then generates a radial visualization of other books similar to the central book, showing the strength of the connection by the thickness of the connecting line and characteristic ('StoryDNA'). Users can switch between StoryDNA connections via drop list, and can click on an outer book to recenter the tool on that book. BookLamp and its tools have been retired as of April 2014 and the website is no longer available. The main site has been captured by the Internet Archive ( https://web.archive.org/web/20140210212627/http://booklamp.org/ ) but this tool is not among the pages available there.

Rated 0.0 out of 5.

Visualization

Bookworm

Bookworm is a free tool from the Harvard Cultural Observatory designed to generate data from searches on the Open Library and Internet Archives' collections of public domain books. It allows users to search keywords, including in multiple languages simultaneously, and narrow terms by country, gender, subject and header. At present, Bookworm is restricted to searching books published between 1820 and 1920 due to availabliity. The tool produces a graph showing instances of each keyword over time, enabling easy comparison of results.

Rated 0.0 out of 5.

Visualization

bubbl.us

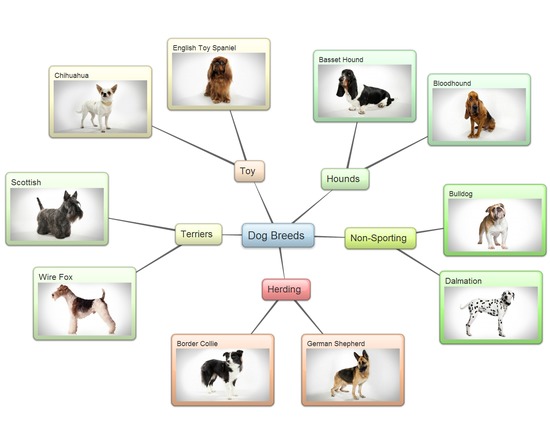
bubbl.us is a web-based mind mapping tool, useful for organizing ideas, brainstorming, analyzing relationships, and visualizing data. Simple interface, with basic and easily understood functionality. Free to try without creating an account. Also available as an iOS application for iPad. Free account allows creation of three mind maps, with minimal customization (e.g., text size and formatting, bubble color and hierarchy) Expanded functionality, export options, and unlimited map creation with upgraded accounts Monthly or annual subscription options for individual account upgrade, including 30-day free trial Group licensing option offered for collaborative use by teams, including custom branding Eligible teams may apply for educational discount by emailing support@bubbl.us

Rated 0.0 out of 5.

Visualization

CartoDB

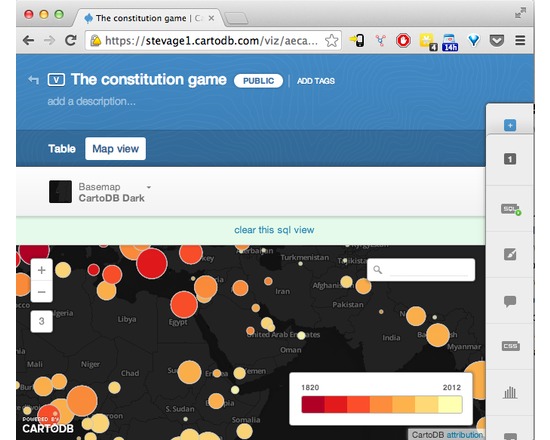
CartoDB makes data-driven map visualisation tool. It's very easy to upload a couple of spreadsheets of data, with latitudes and longitudes or addresses, and turn them into clickable markers on maps. There are several types of pre-canned visualisation, such as categories, choropleths or even animated "torque" maps. It's also a sophisticated platform allowing complex visualisations to be built up using Javascript and the CartoDB API.

Rated 0.0 out of 5.

Visualization

Casual

Casual is a free, open source tool for generating a visualization of concepts from a key word search. It uses Wikipedia for conceptual information, and can also include Google Image search results where applicable. Users can click on a term to generate a new search from that term, while image results can be rearranged by clicking and dragging them to the desired location. Casual can produce visualizations ranging from 10 to 400 concepts in size, and can retrieve information for queries in a wide variety of languages. This tool is no longer supported; development appears to have ceased in 2009.

Rated 0.0 out of 5.

Visualization

CATMA: Computer Aided Textual Markup & Analysis

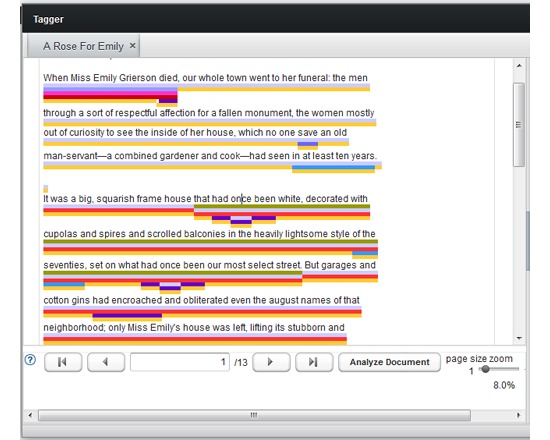
CATMA (Computer Aided Textual Markup & Analysis) is a free, open source markup and analysis tool from the University of Hamburg's Department of Languages, Literature and Media. It incorporates three interactive modules: (1) The tagger enables flexible and individual textual markup and markup editing. (2) The analyzer incorporates a query language and predefined functions. It also includes a query builder that allows users to construct queries from combinations of pre-defined questions while allowing for manual modification for more specific questions. (3) The visualizer provides basic visualization options for texts and corpora. CATMA also interfaces with the Voyant toolset. As of version 4.1, CATMA is a web application with collaborative work functions, and improvements to its user interface, queries and corpus analysis capacity. Version 4.2 offers, among others, new visualization options.

Rated 0.0 out of 5.

›

Curated lists

Curated list created by experience authors in the fields.

All curated lists

Geoffrey Rockwell

Cool Voyant Tools

Not all Voyant tools show up in the default view or skin. Here is a list of some of the other tools worth trying.

4 tools

View list

Holly Pickering

Audio Production Software

Interested in audio production and editing? Here are a few programs that can help you get on your way. Some of them are free, some not, but all are helpful and useful.

3 tools

View list

Jason Bradshaw

TATR: Text Analysis for Twitter Research

This list compiles a suite of tools that make up Kynan Ly's Text Analysis for Twitter Research (TATR) Library. Recipes to these notebooks can be found on methodi.ca

6 tools

View list

The catalogue

  • 1321

    Tools catalogued

  • 15

    Curated lists

  • 22

    Analysis types

  • 671

    Community reviews

More is coming

Researchers, power users, and students will soon be able to contribute tools, share reviews, and curate lists around their own work.