Skip to content
TAPoR Text Analysis Portal for Research

For researchers who work with text

Find a text analysis tool that fits the work.

TAPoR catalogues concordancers, annotators, topic models, stylometry packages, and visualization environments. Every record notes the platform, the license, and what the tool is actually good for.

  • Platform, license, and method on every record
  • Reviews from people who teach with the tools
  • Lists assembled around a course or a corpus

Browse tools

Filter by the type of analysis.

View all tools
‹

Creation

Plone

Plone is a powerful, flexible, open source Content Management System (CMS) built on top of Zope application server and CMF. Features: - Flexible and adaptable workflow - Customisable - Free add-ons - Versioning, history and reverting content - Support for multiple mark up formats - Multilingual content management - RSS feed support - WebDAV and FTP support - WYSIWYG - Integrates with Active Directory, Salesforce, LDAP, SQL, Web Services, LDAP and Oracle

Rated 0.0 out of 5.

Visualization

plot.ly

Plot.ly is a free to educational (public) user web-based graphic tool that combined leading edge visualisations with a user-friendly, guided creation experience. Accepting data in a variety of forms, it leads the user through creation and sharing and then facilitates discussion around the output objects. The data, the code and any algorithm transformations are freely accessible to all users and products are easily embedded in other documents for presentation purposes. Plot.ly also offer their services on a paid basis to enterprise users. plotly.js is a freely available javascript framework open for developers.

Rated 0.0 out of 5.

Plotting Characteristic Curve of Word Lengths

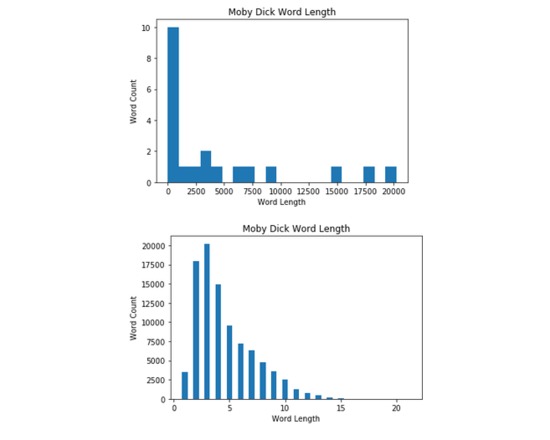
Code that reads a .txt files and plot the characteristic curve of words lengths of the text. Finally it graphs it using matplotlib

Rated 0.0 out of 5.

Plotting Distribution

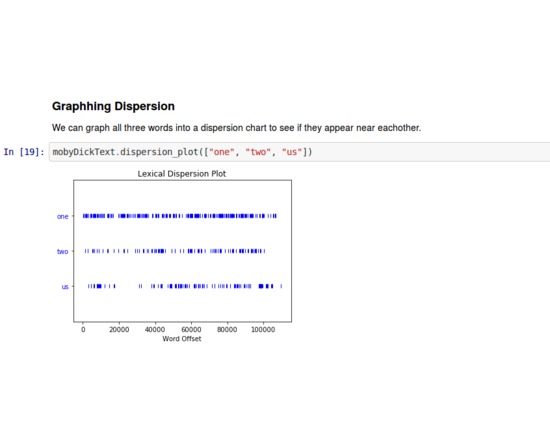
Reading a .txt file and storing it. Afterward finding the word count and word distribution and graphing it with matplotlib.

Rated 0.0 out of 5.

Plotting Word Frequency

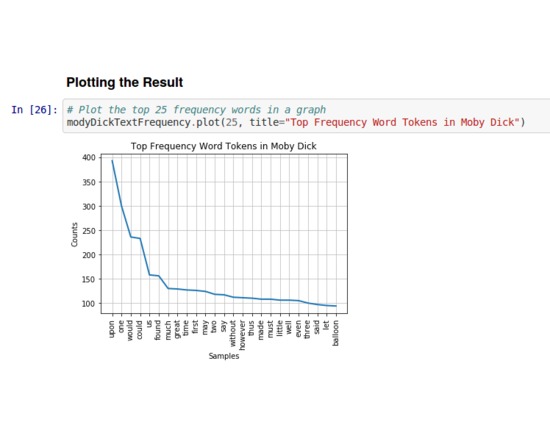
Reads a .txt file and plot the word frequency using matplotlib.

Rated 0.0 out of 5.

Gathering

Pocket

Pocket was founded in 2007 by Nate Weiner to help people save interesting articles, videos and more from the web for later enjoyment. Once saved to Pocket, the list of content is visible on any device — phone, tablet or computer. It can be viewed while waiting in line, on the couch, during commutes or travel — even offline.

Rated 0.0 out of 5.

›

Curated lists

Curated list created by experience authors in the fields.

All curated lists

Geoffrey Rockwell

Cool Voyant Tools

Not all Voyant tools show up in the default view or skin. Here is a list of some of the other tools worth trying.

4 tools

View list

Holly Pickering

Audio Production Software

Interested in audio production and editing? Here are a few programs that can help you get on your way. Some of them are free, some not, but all are helpful and useful.

3 tools

View list

Jason Bradshaw

TATR: Text Analysis for Twitter Research

This list compiles a suite of tools that make up Kynan Ly's Text Analysis for Twitter Research (TATR) Library. Recipes to these notebooks can be found on methodi.ca

6 tools

View list

The catalogue

  • 1321

    Tools catalogued

  • 15

    Curated lists

  • 22

    Analysis types

  • 671

    Community reviews

More is coming

Researchers, power users, and students will soon be able to contribute tools, share reviews, and curate lists around their own work.