Google Wonder Wheel
Google allows you to see relevant search results to your query in a unique semantically relevant and graphically designed way.
For researchers who work with text
TAPoR catalogues concordancers, annotators, topic models, stylometry packages, and visualization environments. Every record notes the platform, the license, and what the tool is actually good for.
Filter by the type of analysis.
Google allows you to see relevant search results to your query in a unique semantically relevant and graphically designed way.

Collaboration
Social networking platform, not unlike Facebook, that works with other Google services and allows users to connect with and see what friends are doing. Users can create posts and share links or multimedia items with select groups (called Circles). The Hangouts feature allows group video chat.
Search
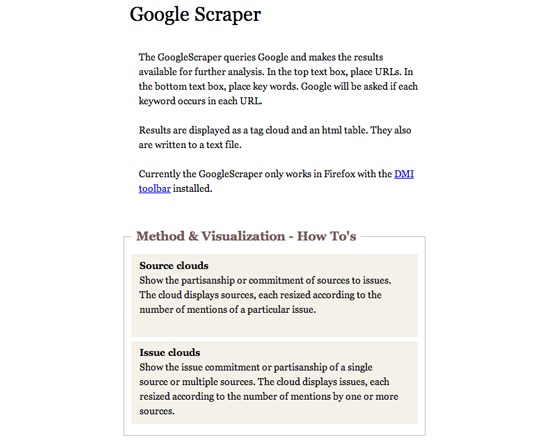
Googlescraper (Lippmannian Device) is a free, web-based tool for querying Google and saving the results for analysis. It allow users to specify URLs, keywords, and which keywords apply to each URL. The tool outputs as HTML, a tag cloud, and a text file. The tool must be used with FireFox, and requires users to first install the DMI toolbar , which permits the tool to work around Google's block against automated requests.

Visualization
GPS Visualizer is a free, easy-to-use online utility that creates maps and profiles from GPS data.
Visualization
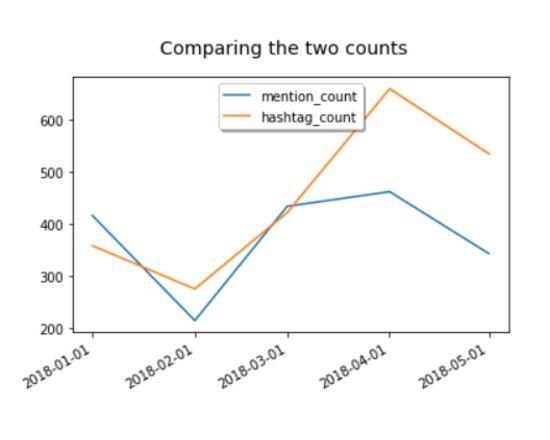
TATR: Graphing This notebook is part of a greater series of Juypter Notebook structured around Twitter Tweet analysis. This particular notebook will look at graphing. From saving the resulting graph to organization. This notebook will provide the a framework that can be expanded to suit your needs.
Visualization
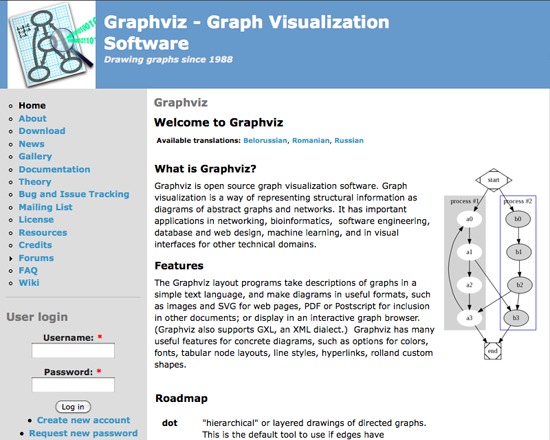
Graphviz is a free, open source graph visualization tool in constant development since 1988. It represents structural information as diagrams of abstract graphs and networks.
Week of 1 Nov – 7 Nov
Three tools from the catalogue, each rated at least 3 stars. A new set appears each Sunday.
Curated list created by experience authors in the fields.

Geoffrey Rockwell
Not all Voyant tools show up in the default view or skin. Here is a list of some of the other tools worth trying.
4 tools
View list
Holly Pickering
Interested in audio production and editing? Here are a few programs that can help you get on your way. Some of them are free, some not, but all are helpful and useful.
3 tools
View list
Jason Bradshaw
This list compiles a suite of tools that make up Kynan Ly's Text Analysis for Twitter Research (TATR) Library. Recipes to these notebooks can be found on methodi.ca
6 tools
View list1321
Tools catalogued
15
Curated lists
22
Analysis types
671
Community reviews
Researchers, power users, and students will soon be able to contribute tools, share reviews, and curate lists around their own work.