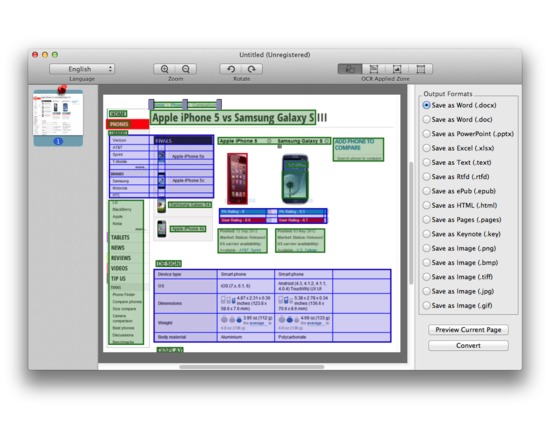
A tool to convert Normal/Scanned PDF and Image to Word, Excel, PPT, Keynote, Pages, Text, etc. on Mac. Features: Convert PDF to Word (.doc), Excel (.xlsx), and More Common Office Format Files Convert PDF to Pages and Keynote Convert PDF to Graphics Files Convert Scanned PDF with Accurate OCR Convert Multilingual PDF Files Support Password-Restricted PDF Files Extract Portions of Text, Image or Table for Reconstruction of Document
Circos is a free visualization tool for creating publication-quality infographics and illustrations. Its visualizations are arranged in a circle to facilitate exploring relationships between objects and positions, which also has the benefit of offering a high data-to-ink ratio. Though promoted for the sciences, it is highly flexible and can visualize datasets from a wide variety of fields.
The “CINCO SCCE Meta Tooling Framework” is a generator-driven development environment for domain-specific graphical modeling tools. It is based on the Eclipse Modeling Framework and Graphiti Graphical Tooling Infrastructrure, but aims to hide much of their complexity and intricate APIs. A graphical modeling tool developed with CINCO is completely generated from an intuitive higher-level abstract specification language. Semantics-inducing parts of the tool that are difficult to define in an abstract declarative way (such as model interpreters, transformations, or code generators) are written in Java against a simple model-based API. CINCO handles the inclusion of the right buttons in the GUI that trigger those actions. Furthermore, CINCO supports the integration of the Java Application Building Center (jABC) into the development process, so that even people with little or no programming experience can express model behavior in a process-oriented fashion.
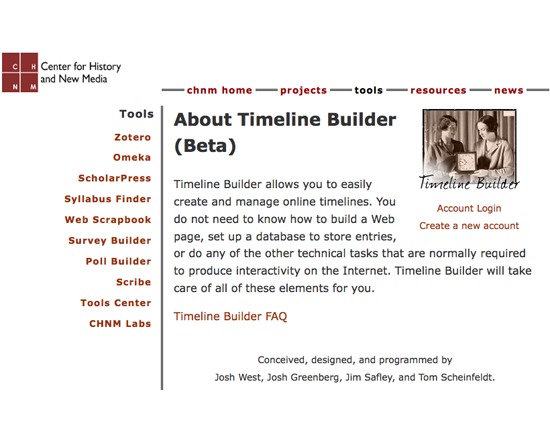
Timeline Builder is a free tool for creating and maintaining interactive, Flash-based timelines for viewing on the web. Basic text formatting and links to other resources can be added through basic HTML. This tool requires registration through the web page.
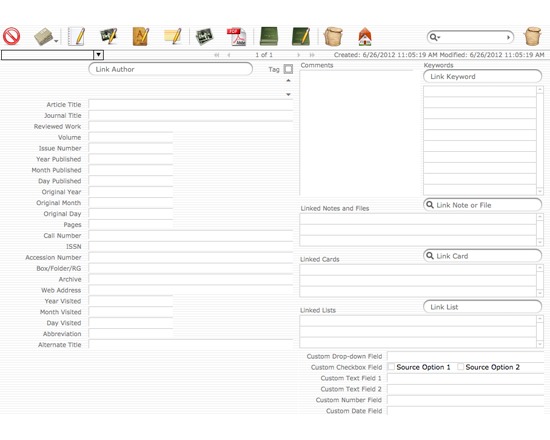
Scribe, now in version 3.5, is a free note-taking program available for both PC and Mac. Aimed particularly at historians, this program allows researchers to create digital note cards for managing sources, research notes, contacts, images, glossaries, outlines, timelines and more. Furthermore, it enables organization, keyword indexing, searching, linking and cross-referencing of all entries. Entries can be entered directly or imported from online catalogues such as Amazon.com. Information entered in Scribe can be exported directly to Zotero in addition to assembling, printing or copying formatted bibliographies directly from the program. Articles can be stored directly within the program, enabling researchers to search out and highlight particular words within the text in addition to the relevant researcher notes.
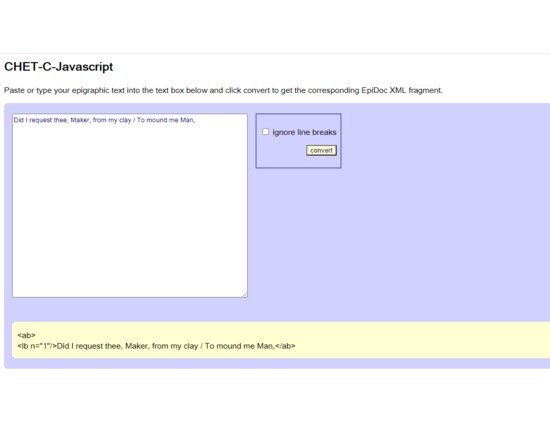
CHET-C, or Chapel Hill Electronic Text-Converter, is a browser based software tool designed to convert digital texts that employ standard epigraphic conventions such as the Leiden sigla into EpiDoc-compliant XML files. The tool can be accessed online at http://www.stoa.org/projects/epidoc/stable/chetc-js/chetc.html. Fragments of epigraphic text using standard sigla (eg Leiden convention markup) are pasted into the tool and Epidoc compliant XML is generated. Prior versions exist (MSAccess + VBA and Java, both now deprecated) for use by those without stabel web access or who wish to customise the underlying regular expressions to process non standard sigla
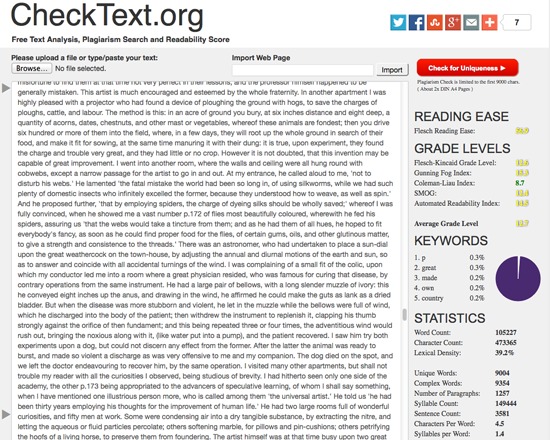
CheckText is a free, web-based text analysis tool. Users can paste in text, upload it from their files, or import content from a web page. For each text, CheckText generates statistics such as word count, syllable count or number of complex words, provides a reading ease and level breakdown, and graphs the most frequent words. The tool also offers a uniqueness check aimed at detecting plagiarism, and generates a PDF report containing the full text with the statistical and readability data.
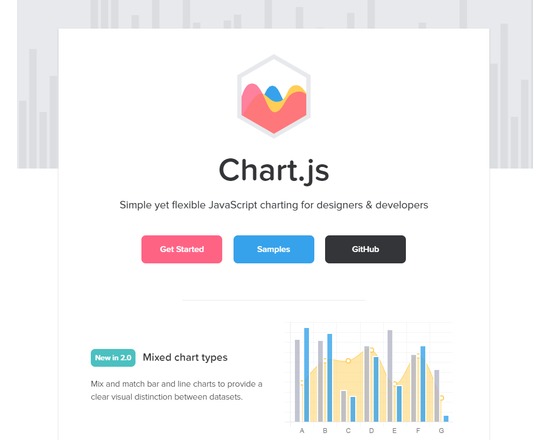
Simple yet flexible JavaScript charting for designers & developers. Open source: Chart.js is a community maintained project, contributions welcome! 8 Chart types: Visualize your data in 8 different ways; each of them animated and customisable. HTML5 Canvas: Great rendering performance across all modern browsers (IE9+). Responsive: Redraws charts on window resize for perfect scale granularity.
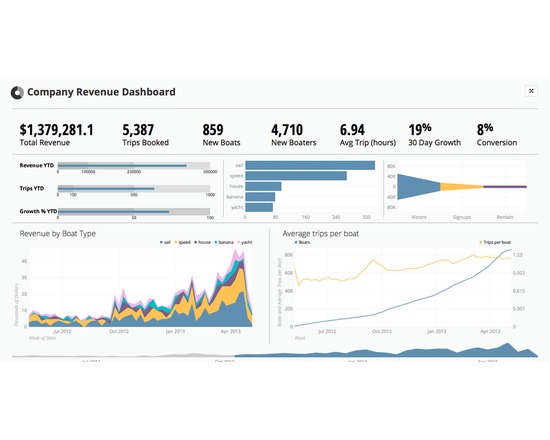
Create interactive charts and perfect dashboards through an intuitive drag and drop interface. Switch from basic tables to sophisticated data visualizations in a single click. Powerful filters let you slice and dice your data, and you can drill down into most charts without configuring a thing. Chartio currently provides nine essential visualization types that can be tweaked, designed, and iterated in any number of ways. Chartio lets you blend data sources in-browser, without the need to clean or format your data in advance. At the very moment you start to explore your data sources, you can blend them together with just a few clicks and chart the results.
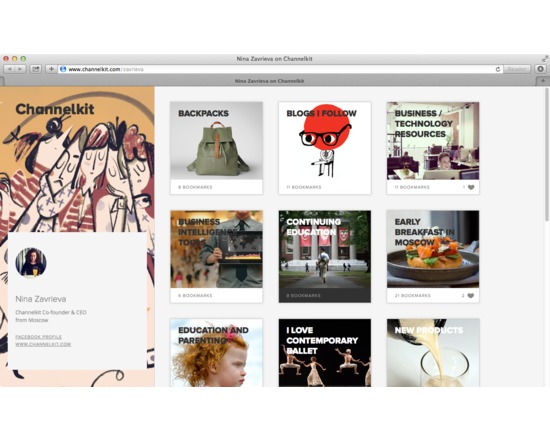
Channelkit lets you save, organize and share links to websites, articles, places, videos and anything else you might need on the web and discover content curated by others.