The amount of online data annotated with geospatial and temporal metadata has grown rapidly in the recent years. Providers like Flickr and Twitter are popular, but hard to browse. Many systems exist that, in multiple linked views, show the data under geospatial, temporal, and topical aspects. GeoTemCo is a web-application which easily can be utilized to visualize such kind of data, and furthermore, it allows the comparative analysis of several datasets. GeoTemCo consists of several views showing the datas' several dimensions: a map view for the geospatial distribution of items, a time view for the temporal distribution of items and a detail view for the inspection of individual items. A broad range of interaction abilities allows for explorative comparison and analysis of different datasets representing different topics. GeoTemCo focuses on supporting the user to: - analyze and compare temporal trends - analyze and compare geospatial distributions - detect cooccurences between data items of different datasets - compare geospatial migrations of topics over time - find causalities between different datasets
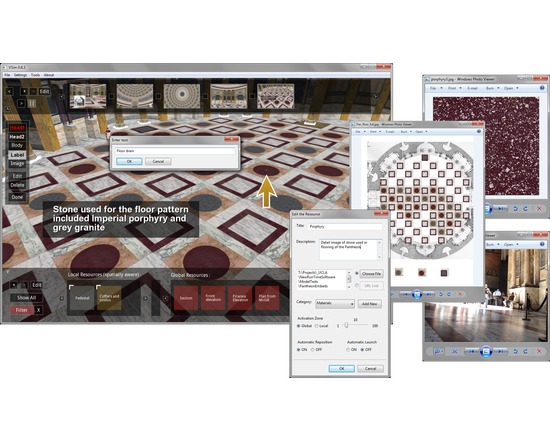
VSim facilitates the real-time exploration of highly detailed, three-dimensional computer models in both formal and informal educational settings. Beyond real-time interaction with three-dimensional content, this NEH-funded software offers two critical functions for academic use of interactive computer models: the narrative feature allows users to create linear presentations within the virtual space (akin to PowerPoint or Prezi within a three-dimensional world), and the embedded resource section allows users to embed within the virtual space annotations and links to primary and secondary resources about the modeled environment.
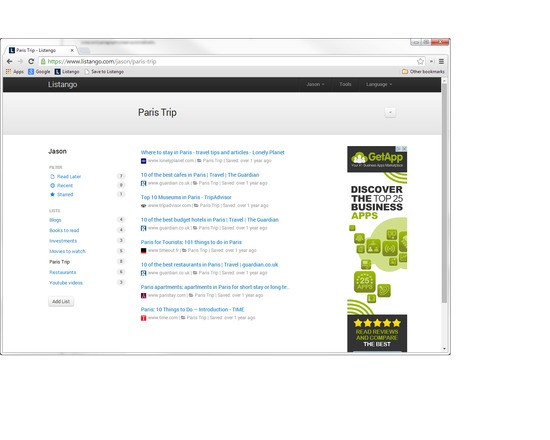
Listango is a free online bookmarking app. Users can save links to web pages and articles using a bookmarklet, organize their links into public or private lists, and share links with friends using Facebook, Twitter or email. Because it is web-based, users can access their bookmarks from any device, anywhere. Listango also offers a free IOS bookmarking app. Listango is designed to work on all modern web browsers, including Google Chrome, Firefox, Safari, and the latest version of Internet Explorer.
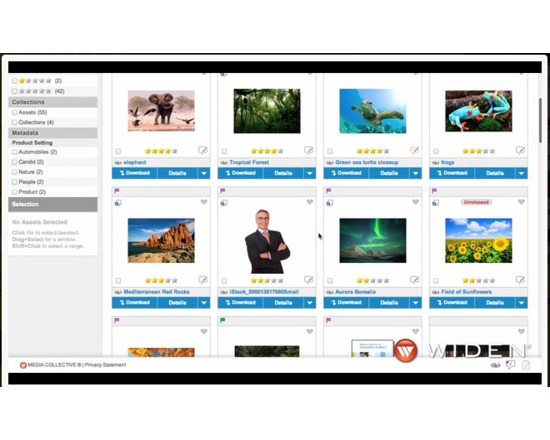
A marketing technology company offering cloud-based digital asset management that facilitates finding/organizing/sharing images, and media files (video, etc.) Although pricing is custom built based on required features and users, they do offer discounts for non-profit and education institutions. Features include: On-the-fly file conversions for images, audio & video, Image watermarking, Unlimited user roles with configurable permissions, Fully configurable metadata schema with read/write ability, Asset group level security for lifecycle management.
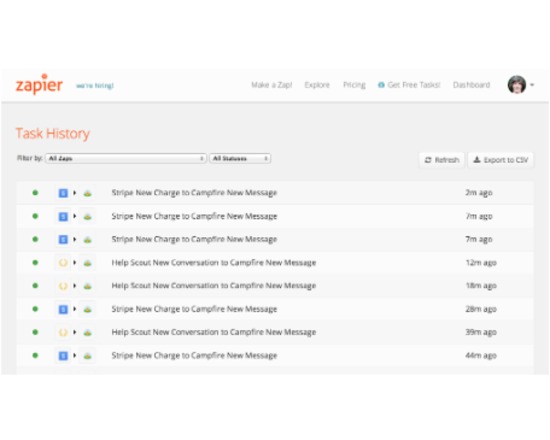
Zapier provides a means to create on-the-fly data connections between applications which may not have open API's. Zapier works with a wide range of popular applications - a list of current ones is available at: https://zapier.com/zapbook/apps/. The creation of Zaps (specific trigger -action definitions) is done using a simply graphical interface and can perform and wide variety of tasks. Examples include: receive a tweet and add it to a row in a google spreadsheet; add a card to trello from an email; post to Facebook from an RSS feed.
Share a project action board in real time, see milestones and upcoming goals. Easy-to-use features allows for edits in the project timeline, and the tracker predicts timeline for next goal achievement based on previously entered data. You can create individual project lines, or stories, that come together to create an epic, or larger project. There are charts showing your historical trends and anything else you'd like to monitor. This tool works with various other apps, listed here: http://www.pivotaltracker.com/community/app-bazaar
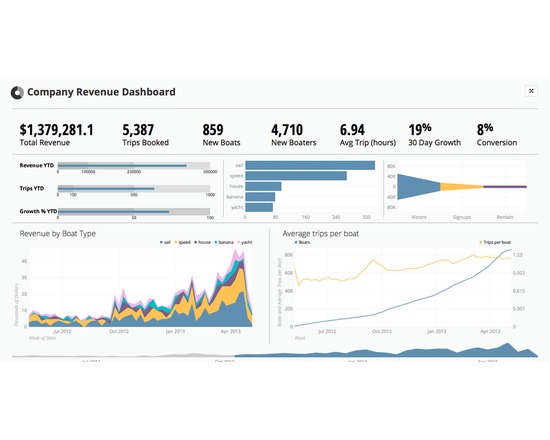
Create interactive charts and perfect dashboards through an intuitive drag and drop interface. Switch from basic tables to sophisticated data visualizations in a single click. Powerful filters let you slice and dice your data, and you can drill down into most charts without configuring a thing. Chartio currently provides nine essential visualization types that can be tweaked, designed, and iterated in any number of ways. Chartio lets you blend data sources in-browser, without the need to clean or format your data in advance. At the very moment you start to explore your data sources, you can blend them together with just a few clicks and chart the results.
Slack is a team-based communication and archiving platform. It allows for both synchronous and asynchronous communications, channels for managing specific streams, full user management and integration with a wide variety of social media and storage providers. It is free for limited (rather generous) use and provides one the best means to allow for individual communication patterns within a managed project to be facilitated. Allowing for the quick and informal communications, hashtagged for quick scanning and searching as well as targeted messaging makes it a very compelling project tool. The addition of specific mobile clients with notifications makes it a very effective project management tool.
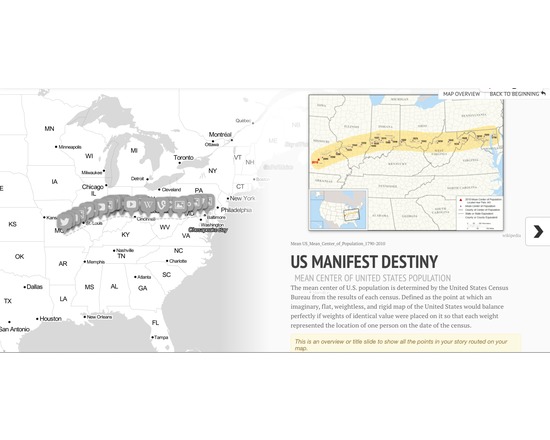
StoryMapJS is a project by KnightLab which aims to help journalists and historians tell stories by using maps using a straight-forward and simple authoring tool. It is constructed around a framework of highlighting the locations of a series of events. As an editing tool, it is relatively intuitive and easy to use.