GIMP is image editing software, much like Photoshop. It is a multi-platform software application primarily used for image composition and editing. The basic tool may be augmented by plug-ins and extensions that allow the use of new file formats, effects filters and batch processing capabilities. GIMP was initially created to manipulate raster images, but has been extended to provide limited vector image and moving image support. A number of free extensions are available in the plugin registry.
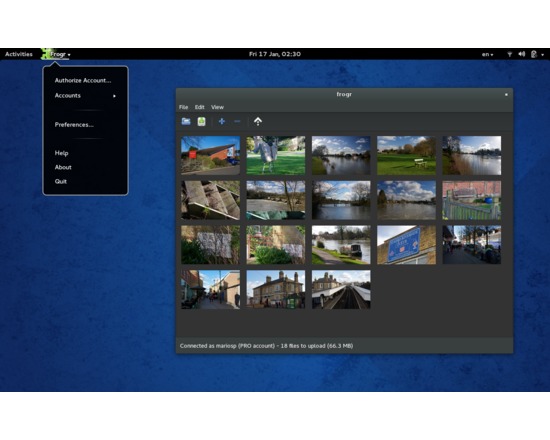
Frogr is a small application for the GNOME desktop that allows users to manage their accounts in the Flickr image hosting website. It supports all the basic Flickr features, including uploading pictures, adding descriptions, setting tags and managing sets and groups pools. The latest stable version of Frogr (0.10) currently features a basic flickr uploader with the following features: Allow upload of pictures and videos to flickr, specifying details such as title, description, tags, visibility, content type, safety level and whether to "show up on global search results". Allow uploading pictures and videos from remote machines, through different protocols (SMB, SSH, FTP...). Allow loading/saving the work session from/to 'project' files. Allow setting specific licenses and geolocation information for pictures right from the desktop. Allow specifying sets and group pools for the elements to be added to after the upload process. Allow to create sets right from frogr, opposite to just adding elements to already existing ones. Command line interface and integration as MIME type handler for pictures. Import tags from picture's metainformation (if present) when loading. Support for handling multiple Flickr accounts. Support for specifying HTTP proxies manually. Integrated with GNOME Shell and the Mac OS X desktops.
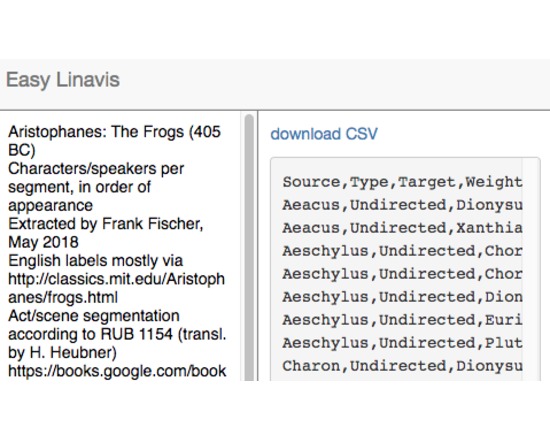
Easy Linavis (ezlinavis) generates CSV files with network data from simple segmentations of literary texts that you can further visualise and analyse with Gephi or other tools. It provides more than 20 example files to make it easier to start.
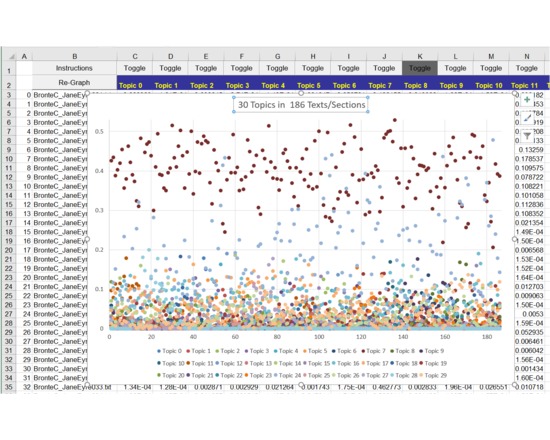
A Microsoft Excel spreadsheet with macros, to facilitate the visualization and analysis of Mallet topics. This spreadsheet accepts data from a topic model produced by Mallet. This sheet currently contains six macros that can be run by clicking the appropriate buttons.
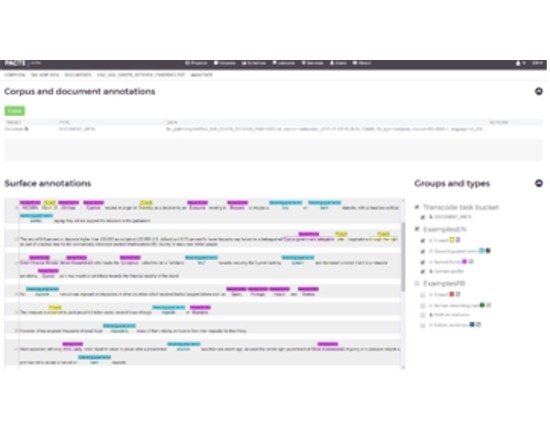
PACTE is a collaborative electronic text annotation platform which is newly-developed by CRIM. PACTE deals with text content and there are three annotation modes( manual, semi-automatic and automatic) for users to choose. Research groups can take advantages of its collaborative nature which allows sharing of analyses and annotations with other members. Other web automated web annotation services based on CRIM’s advanced analytic algorithms are available in this platform, which are used for linguistic analysis, lexical data and semantic analysis. Users can only use this platform if the administrator validates their registration.
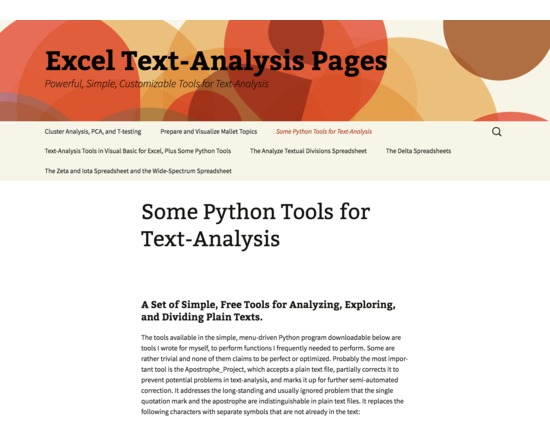
This is a set of simple, free tools for analyzing, exploring, and dividing plain texts. The tools are available in the simple, menu-driven, downloadable Python program. Some are rather trivial and none of them claims to be perfect or optimized. Probably the most important tool is the Apostrophe_Project, which accepts a plain text file, partially corrects it to prevent potential problems in text-analysis, and marks it up for further semi-automated correction. It addresses the long-standing and usually ignored problem that the single quotation mark and the apostrophe are indistinguishable in plain text files. It replaces the following characters with separate symbols that are not already in the text: •Internal apostrophes: presumably real apostrophes •Non-internal apostrophes preceding capital letters: usually scare quotes or dialogue marked with single quotation marks •Non-internal apostrophes following a word-final “s”: usually plural possessives •Non-internal apostrophes in very commonly used contracted forms: ’em, an’, ’twas, and so forth •Non-internal apostrophes between other breaking characters: essentially never anything but single quotation marks
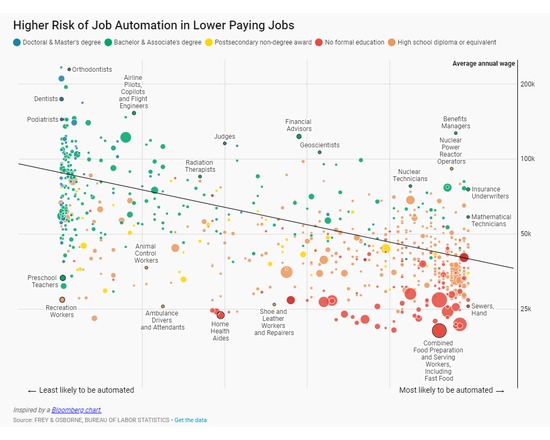
Datawrapper is a tool built to make it easy for journalists and other content-creators to create simple charts and maps for web articles. To make a chart, you paste in your numbers and choose a chart type. We make sure that the chart you’ll embed in your article at the end is beautiful, responsive and interactive. Our charts feel at home on the web. They’re interactive, responsive and embeddable in your website. No code or design skills required. The way from data to a beautiful chart is shorter than you think. 1. Copy & Paste your data: Simply copy your data from Excel or Google Sheets. You can also upload CSV files or link to an URL for live-updating charts. 2. Visualize: Choose from many chart and map types with one click. Customize and annotate your chart to make it more effective. 3. Publish your chart: Copy the ready-to-use embed code into your CMS or website, or export the chart as an image or PDF to print it.
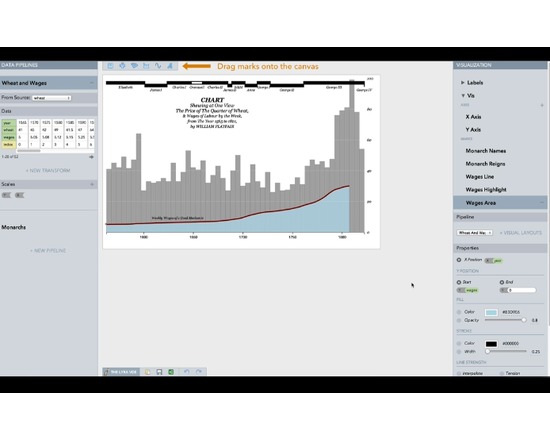
Lyra is an interactive environment that enables custom visualization design without writing any code. Graphical “marks” can be bound to data fields using property drop zones; dynamically positioned using connectors; and directly moved, rotated, and resized using handles. Lyra also provides a data pipeline interface for iterative visual specification of data transformations and layout algorithms. Lyra is more expressive than interactive systems like Tableau, allowing designers to create custom visualizations comparable to hand-coded visualizations built with D3 or Processing. These visualizations can then be easily published and reused on the Web.