Skip to content
TAPoR Text Analysis Portal for Research

For researchers who work with text

Find a text analysis tool that fits the work.

TAPoR catalogues concordancers, annotators, topic models, stylometry packages, and visualization environments. Every record notes the platform, the license, and what the tool is actually good for.

  • Platform, license, and method on every record
  • Reviews from people who teach with the tools
  • Lists assembled around a course or a corpus

Browse tools

Filter by the type of analysis.

View all tools
‹

Visualization

ImageJ

ImageJ is a Java open source image processing program designed for scientific multidimensional images. It is highly extensible, with thousands of plugins and macros for performing a wide variety of tasks, and a strong, established user base. There are three major versions of ImageJ: ImageJ1 - The stable version, developed by Wayne Rasband at NIH since 1997 ImageJ2 - Focuses on analysis of scientific multidimensional image data. Includes ImageJ1 with a compatibility layer Fiji - A distribution of ImageJ for the life sciences. It provides a large number of additional plugins to facilitate analysis of life sciences images, particularly microscopy images. Built on the ImageJ2 platform.
Rated 0.0 out of 5.

Visualization

Improvise

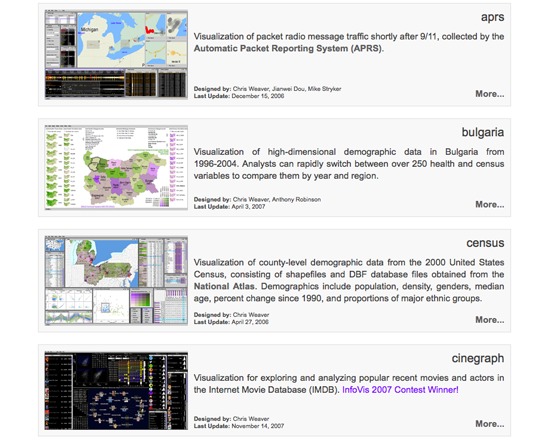
Improvise is a free Java software architecture and user interface designed to enable the construction and browsing of interactive visualizations, integrating a declarative visual query language.

Rated 0.0 out of 5.

Visualization

Infogram

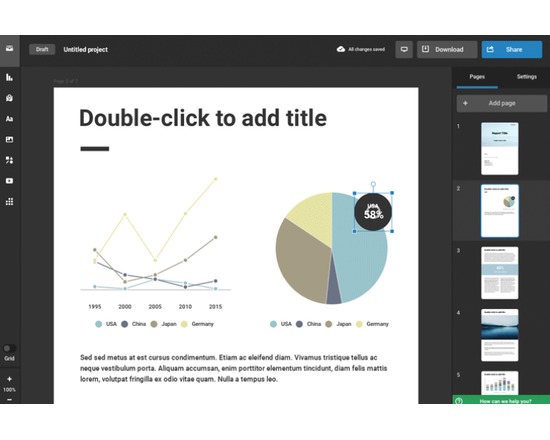
The simple way to make all your data dazzle Infographics: Create stunning infographics that boost visitor engagement on your website or blog. Reports: Stand out with interactive marketing reports, sales collateral, and more. Charts: High-quality graphs and charts are a snap. Just import your data, customize, and share. Dashboards: Connect your data to build live, easily shareable dashboards that visually track your business. Maps: Use our map maker to publish professional-quality interactive maps that impress and inform. Social Media Visuals: Use our huge bank of photos and icons to create stunning images for Facebook, Instagram, and Twitter.

Rated 0.0 out of 5.

Visualization

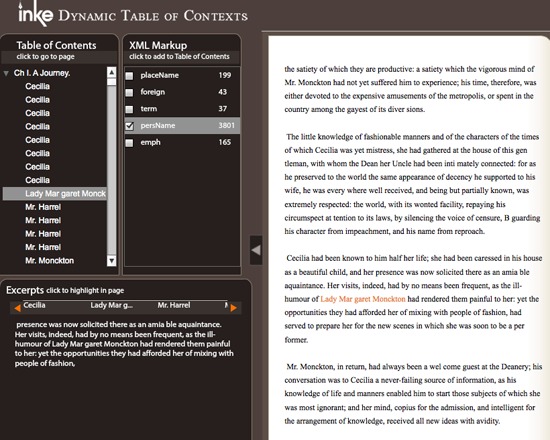
INKE: Dynamic Table of Contexts

Dynamic Table of Contexts is a free tool for supplementing a traditional table of contents for a text. It allows users to add or subtract index items based on XML encoding. This tool requires the creation of an account.

Rated 0.0 out of 5.

Visualization

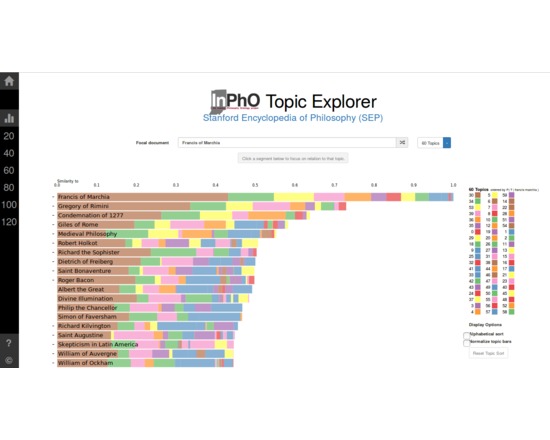
InPh0 Topic Explorer

The InPhO Topic Explorer features a powerful interactive coding environment that enables direct manipulation of the corpus and models, in contrast to the web visualization.

Rated 0.0 out of 5.

Visualization

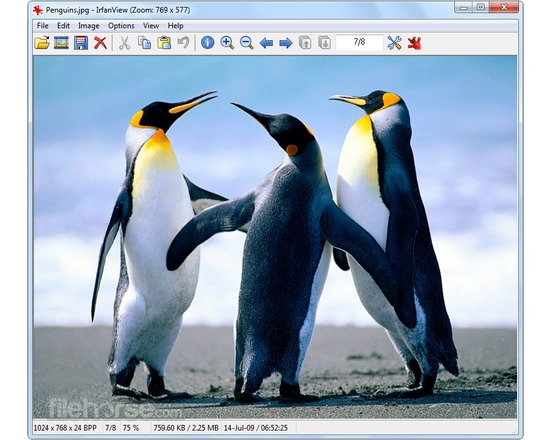
IrfanView

An image viewer and converter with simple editing features; can also generate slideshows and save them as .exe files. Includes support for Photoshop filters.The latest version is 4.51 and this new version support for animate webP files.

Rated 0.0 out of 5.

›

Curated lists

Curated list created by experience authors in the fields.

All curated lists

Geoffrey Rockwell

Cool Voyant Tools

Not all Voyant tools show up in the default view or skin. Here is a list of some of the other tools worth trying.

4 tools

View list

Holly Pickering

Audio Production Software

Interested in audio production and editing? Here are a few programs that can help you get on your way. Some of them are free, some not, but all are helpful and useful.

3 tools

View list

Jason Bradshaw

TATR: Text Analysis for Twitter Research

This list compiles a suite of tools that make up Kynan Ly's Text Analysis for Twitter Research (TATR) Library. Recipes to these notebooks can be found on methodi.ca

6 tools

View list

The catalogue

  • 1321

    Tools catalogued

  • 15

    Curated lists

  • 22

    Analysis types

  • 671

    Community reviews

More is coming

Researchers, power users, and students will soon be able to contribute tools, share reviews, and curate lists around their own work.