Skip to content
TAPoR Text Analysis Portal for Research

For researchers who work with text

Find a text analysis tool that fits the work.

TAPoR catalogues concordancers, annotators, topic models, stylometry packages, and visualization environments. Every record notes the platform, the license, and what the tool is actually good for.

  • Platform, license, and method on every record
  • Reviews from people who teach with the tools
  • Lists assembled around a course or a corpus

Browse tools

Filter by the type of analysis.

View all tools
‹

Visualization

Data-illustrator

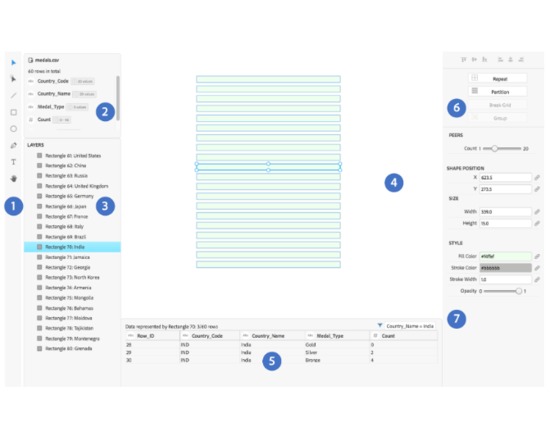
Data Illustrator aims to make visualization creation as easy as creating an illustration in a design tool like Adobe Experience Design or Bohemian Sketch. Visualizations are created without programming. It was created from a research collaboration between Adobe Systems Inc. and Georgia Institute of Technology.

Rated 0.0 out of 5.

Visualization

Dataplot

Dataplot is a free software system for data analysis, including characterization, visualization and modelling. It was developed in FORTRAN 77, and has been in continuous development since 1978. Dataplot is well-documented, with numerous tutorials for using and extending it. In addiiton, over 30 graphic types are supported, such as histograms, box plots, scatter plots and normal probability plots. This tool is currently available in Unix, Linux, OS X and Windows versions. Dataplot is open source, but is trademarked rather than licensed.

Rated 0.0 out of 5.

Datapress

Datapress is a wordpress plugin that allows you to configure beautiful data presentations for your blog entries using MIT’s Exhibit framework.

Rated 0.0 out of 5.

Visualization

DataTank

The DataTank is an open source tool that publishes data, stored in text-based files (e.g., CSV, XML, JSON) or in binary structures (e.g., SHP files, relational databases). The DataTank reads data from these structures and publishes them to the web using a URI as an identifier, providing these data in any format a user wants regardless of the original data structure. The DataTank requires a server with Apache2 or Nginx, mod rewrite enabled, PHP 5.4 or higher, Git, any database supported by Laravel 4. Features Turn any dataset into a RESTful HTTP API Allows published data to be requested in any web-readable format or visualization Improves the ease, openness, and transparency of data consumption Enables data consumers to immediately begin working, without needing to download raw data files Provides visualizations for immediate data interpretation and information gathering by civilians Resources The DataTank demo Documentation GitHub

Rated 0.0 out of 5.

Dataverse

The Dataverse Network is an application to publish, share, reference, extract and analyze research data. It facilitates making data available to others, and allows to replicate others work. Researchers and data authors get credit, publishers and distributors get credit, affiliated institutions get credit.

Rated 0.0 out of 5.

Visualization

Datawrapper

Datawrapper is a tool built to make it easy for journalists and other content-creators to create simple charts and maps for web articles. To make a chart, you paste in your numbers and choose a chart type. We make sure that the chart you’ll embed in your article at the end is beautiful, responsive and interactive. Our charts feel at home on the web. They’re interactive, responsive and embeddable in your website. No code or design skills required. The way from data to a beautiful chart is shorter than you think. 1. Copy & Paste your data: Simply copy your data from Excel or Google Sheets. You can also upload CSV files or link to an URL for live-updating charts. 2. Visualize: Choose from many chart and map types with one click. Customize and annotate your chart to make it more effective. 3. Publish your chart: Copy the ready-to-use embed code into your CMS or website, or export the chart as an image or PDF to print it.

Rated 0.0 out of 5.

›

Curated lists

Curated list created by experience authors in the fields.

All curated lists

Geoffrey Rockwell

Cool Voyant Tools

Not all Voyant tools show up in the default view or skin. Here is a list of some of the other tools worth trying.

4 tools

View list

Holly Pickering

Audio Production Software

Interested in audio production and editing? Here are a few programs that can help you get on your way. Some of them are free, some not, but all are helpful and useful.

3 tools

View list

Jason Bradshaw

TATR: Text Analysis for Twitter Research

This list compiles a suite of tools that make up Kynan Ly's Text Analysis for Twitter Research (TATR) Library. Recipes to these notebooks can be found on methodi.ca

6 tools

View list

The catalogue

  • 1321

    Tools catalogued

  • 15

    Curated lists

  • 22

    Analysis types

  • 671

    Community reviews

More is coming

Researchers, power users, and students will soon be able to contribute tools, share reviews, and curate lists around their own work.