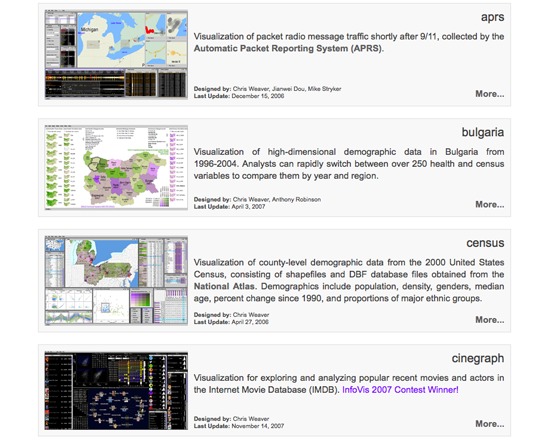
Visualization
Improvise
Improvise is a free Java software architecture and user interface designed to enable the construction and browsing of interactive visualizations, integrating a declarative visual query language.
For researchers who work with text
TAPoR catalogues concordancers, annotators, topic models, stylometry packages, and visualization environments. Every record notes the platform, the license, and what the tool is actually good for.
Filter by the type of analysis.
Visualization
Improvise is a free Java software architecture and user interface designed to enable the construction and browsing of interactive visualizations, integrating a declarative visual query language.
Web development
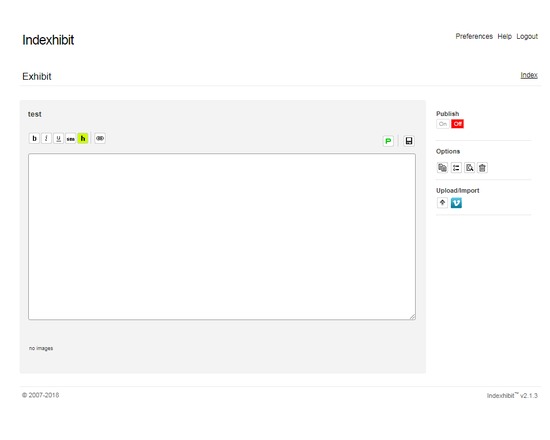
A web application used to build and maintain an archetypal, invisible website format that combines text, image, movie and sound. What is it? Indexhibit is a pioneering CMS web application founded in 2006 which is used to create websites in the established index + exhibit format. The Indexhibit format has become archetypal for the creative community, combining good functionality and usability for the website maker and visitors. Who is it for? Everybody who would like to build and manage their own website embracing the archetypal index + exhibit format. Why use it? To become part of a community of users who place emphasis on content over complicated website design.

Natural Language Processing
Social media research software that provides true understanding of how people feel about any topic being discussed on the social web. Fully customize and white label all your social data projects Integrate social data and text analysis into your business critical applications.
Visualization
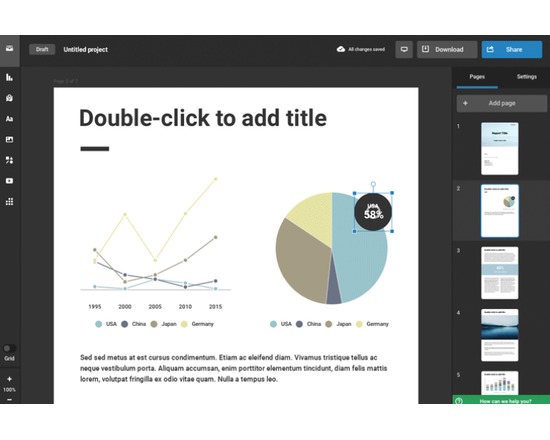
The simple way to make all your data dazzle Infographics: Create stunning infographics that boost visitor engagement on your website or blog. Reports: Stand out with interactive marketing reports, sales collateral, and more. Charts: High-quality graphs and charts are a snap. Just import your data, customize, and share. Dashboards: Connect your data to build live, easily shareable dashboards that visually track your business. Maps: Use our map maker to publish professional-quality interactive maps that impress and inform. Social Media Visuals: Use our huge bank of photos and icons to create stunning images for Facebook, Instagram, and Twitter.
Visualization
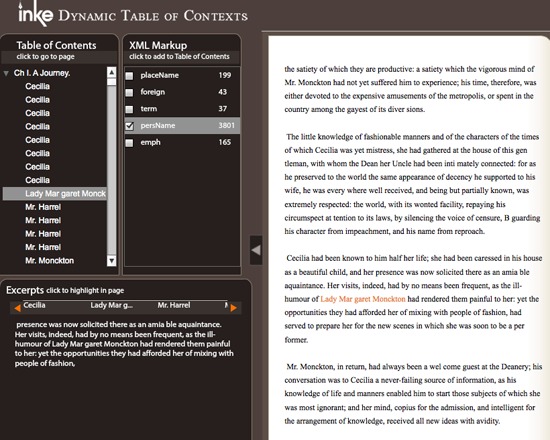
Dynamic Table of Contexts is a free tool for supplementing a traditional table of contents for a text. It allows users to add or subtract index items based on XML encoding. This tool requires the creation of an account.
Uncategorized
Inkscape is an open-source vector based imaging programme similar to Adobe Illustrator, Corel Draw, Freehand, or Xara X.
Week of 1 Nov – 7 Nov
Three tools from the catalogue, each rated at least 3 stars. A new set appears each Sunday.
Curated list created by experience authors in the fields.

Geoffrey Rockwell
Not all Voyant tools show up in the default view or skin. Here is a list of some of the other tools worth trying.
4 tools
View list
Holly Pickering
Interested in audio production and editing? Here are a few programs that can help you get on your way. Some of them are free, some not, but all are helpful and useful.
3 tools
View list
Jason Bradshaw
This list compiles a suite of tools that make up Kynan Ly's Text Analysis for Twitter Research (TATR) Library. Recipes to these notebooks can be found on methodi.ca
6 tools
View list1321
Tools catalogued
15
Curated lists
22
Analysis types
671
Community reviews
Researchers, power users, and students will soon be able to contribute tools, share reviews, and curate lists around their own work.