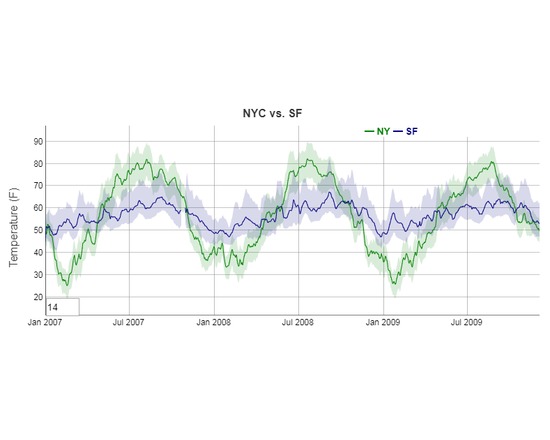
dygraphs is a fast, flexible open source JavaScript charting library. Features: -Handles huge data sets: dygraphs plots millions of points without getting bogged down. Interactive out of the box: zoom, pan and mouseover are on by default. - Strong support for error bars / confidence intervals. - Highly customizable: using options and custom callbacks, you can make dygraphs do almost anything. - dygraphs is works in all recent browsers. You can even pinch to zoom on mobile/tablet devices! - There's an active community developing and supporting dygraphs.
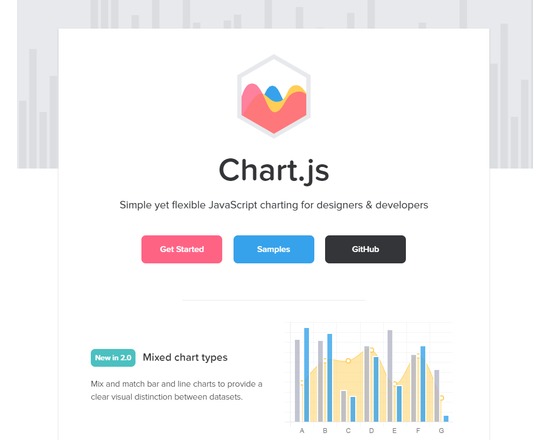
Simple yet flexible JavaScript charting for designers & developers. Open source: Chart.js is a community maintained project, contributions welcome! 8 Chart types: Visualize your data in 8 different ways; each of them animated and customisable. HTML5 Canvas: Great rendering performance across all modern browsers (IE9+). Responsive: Redraws charts on window resize for perfect scale granularity.
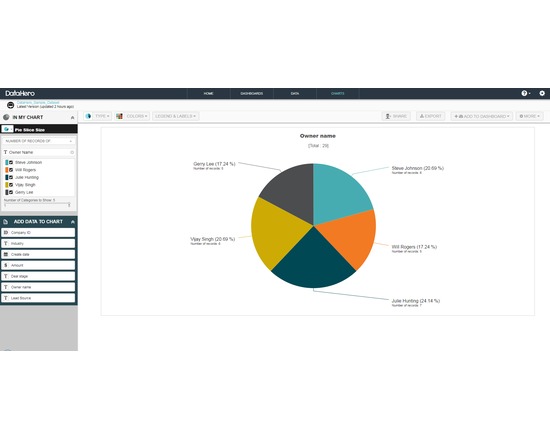
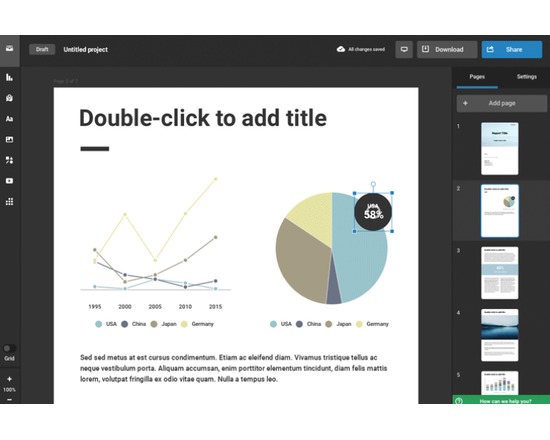
The fastest easiest way to automate business insights. Create charts, reports, and KPI dashboards that everyone can understand. Easily share with teams and clients.
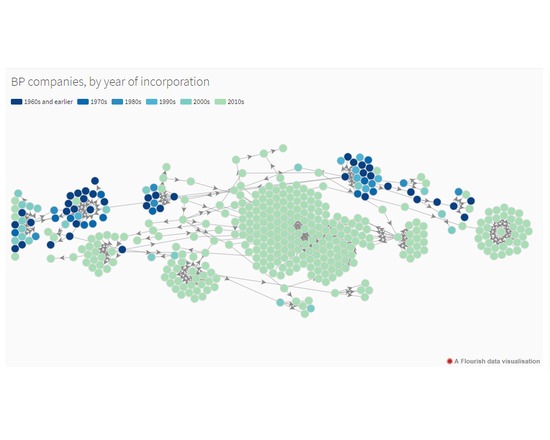
The simple way to make all your data dazzle Infographics: Create stunning infographics that boost visitor engagement on your website or blog. Reports: Stand out with interactive marketing reports, sales collateral, and more. Charts: High-quality graphs and charts are a snap. Just import your data, customize, and share. Dashboards: Connect your data to build live, easily shareable dashboards that visually track your business. Maps: Use our map maker to publish professional-quality interactive maps that impress and inform. Social Media Visuals: Use our huge bank of photos and icons to create stunning images for Facebook, Instagram, and Twitter.
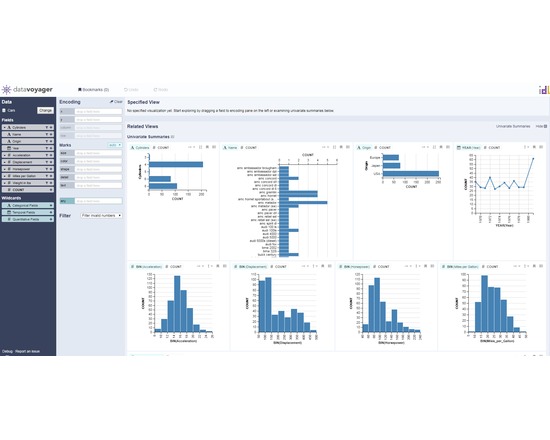
Voyager 2 is a data exploration tool that blends manual and automated chart specification. Voyager 2 combines PoleStar, a traditional chart specification tool inspired by Tableau and Polaris (research project that led to the birth of Tableau), with two partial chart specification interfaces: (1) wildcards let users specify multiple charts in parallel,(2) related views suggest visualizations relevant to the currently specified chart. With Voyager 2, we aim to help analysts engage in both breadth-oriented exploration and depth-oriented question answering.
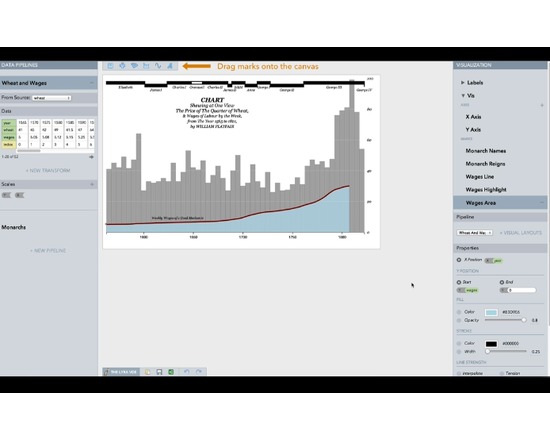
Lyra is an interactive environment that enables custom visualization design without writing any code. Graphical “marks” can be bound to data fields using property drop zones; dynamically positioned using connectors; and directly moved, rotated, and resized using handles. Lyra also provides a data pipeline interface for iterative visual specification of data transformations and layout algorithms. Lyra is more expressive than interactive systems like Tableau, allowing designers to create custom visualizations comparable to hand-coded visualizations built with D3 or Processing. These visualizations can then be easily published and reused on the Web.
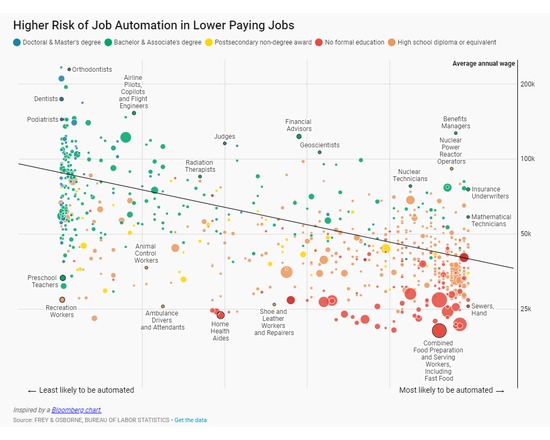
Datawrapper is a tool built to make it easy for journalists and other content-creators to create simple charts and maps for web articles. To make a chart, you paste in your numbers and choose a chart type. We make sure that the chart you’ll embed in your article at the end is beautiful, responsive and interactive. Our charts feel at home on the web. They’re interactive, responsive and embeddable in your website. No code or design skills required. The way from data to a beautiful chart is shorter than you think. 1. Copy & Paste your data: Simply copy your data from Excel or Google Sheets. You can also upload CSV files or link to an URL for live-updating charts. 2. Visualize: Choose from many chart and map types with one click. Customize and annotate your chart to make it more effective. 3. Publish your chart: Copy the ready-to-use embed code into your CMS or website, or export the chart as an image or PDF to print it.
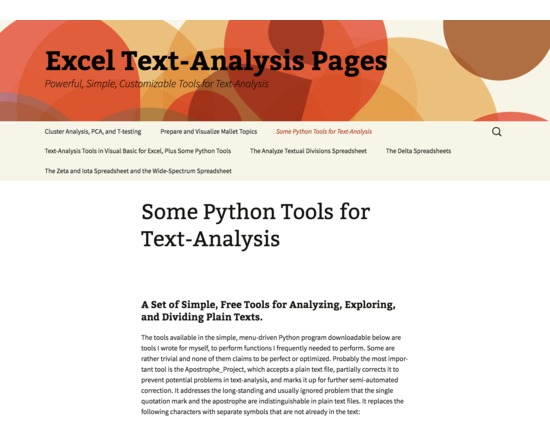
This is a set of simple, free tools for analyzing, exploring, and dividing plain texts. The tools are available in the simple, menu-driven, downloadable Python program. Some are rather trivial and none of them claims to be perfect or optimized. Probably the most important tool is the Apostrophe_Project, which accepts a plain text file, partially corrects it to prevent potential problems in text-analysis, and marks it up for further semi-automated correction. It addresses the long-standing and usually ignored problem that the single quotation mark and the apostrophe are indistinguishable in plain text files. It replaces the following characters with separate symbols that are not already in the text: •Internal apostrophes: presumably real apostrophes •Non-internal apostrophes preceding capital letters: usually scare quotes or dialogue marked with single quotation marks •Non-internal apostrophes following a word-final “s”: usually plural possessives •Non-internal apostrophes in very commonly used contracted forms: ’em, an’, ’twas, and so forth •Non-internal apostrophes between other breaking characters: essentially never anything but single quotation marks
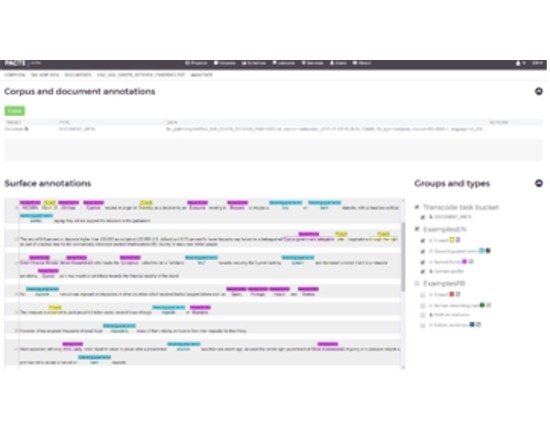
PACTE is a collaborative electronic text annotation platform which is newly-developed by CRIM. PACTE deals with text content and there are three annotation modes( manual, semi-automatic and automatic) for users to choose. Research groups can take advantages of its collaborative nature which allows sharing of analyses and annotations with other members. Other web automated web annotation services based on CRIM’s advanced analytic algorithms are available in this platform, which are used for linguistic analysis, lexical data and semantic analysis. Users can only use this platform if the administrator validates their registration.